
Traffic Data Collection From Camera and Drone Video
Traffic data collection with GoodVision Video Insights turns recorded video from fixed cameras, tripod masts and drones into classified turning movement counts, origin-destination matrices, travel times, speeds and full trajectories. It is built for traffic survey firms, consultancies and modelers. Fixed-camera and low-drone video comes back within hours, at 95%+ accuracy validated against manual counts.
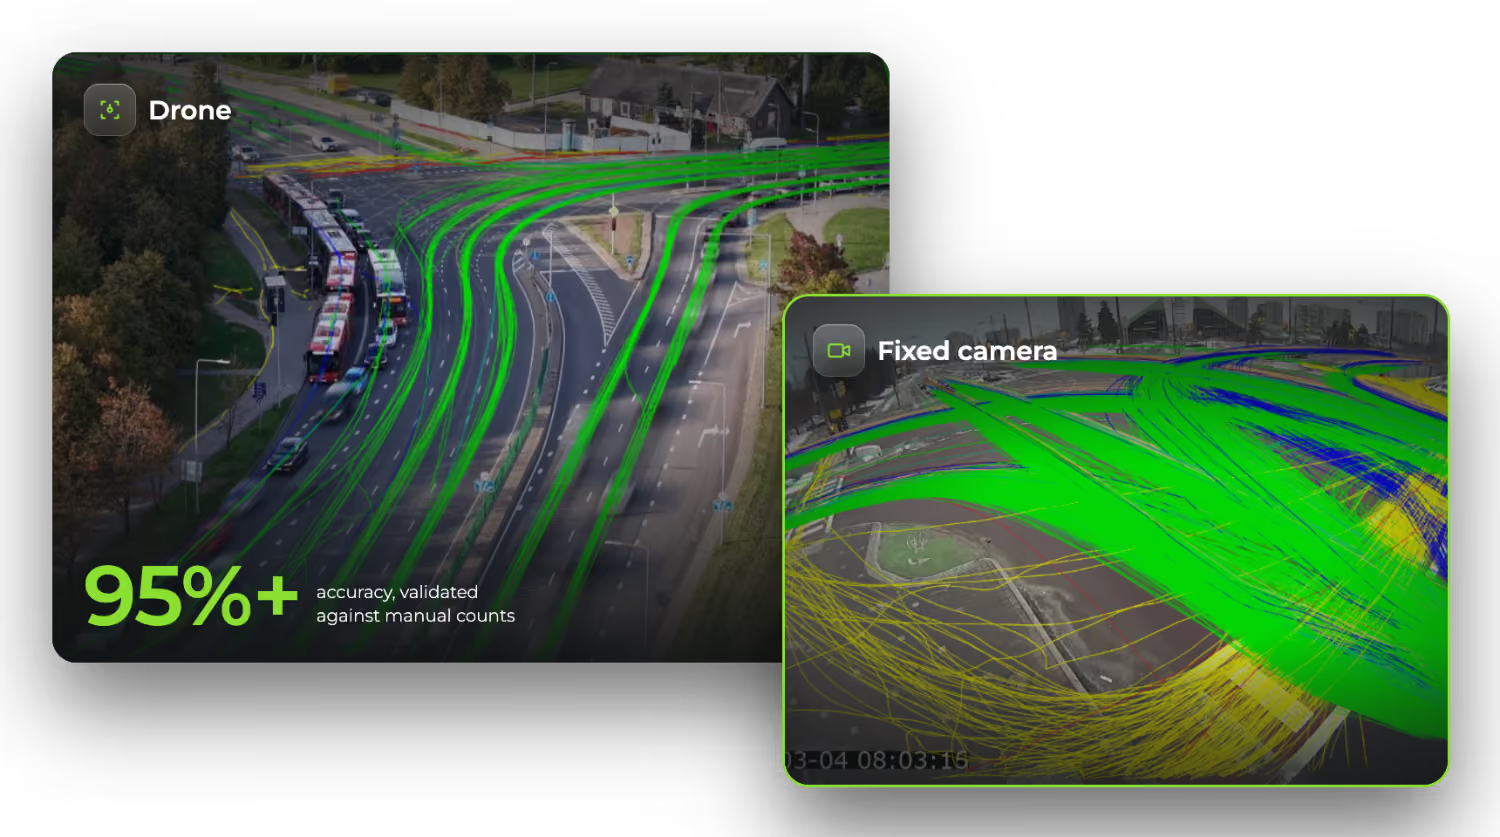
Traffic Data Collection by the Numbers
What Is Traffic Data Collection From Video?
Traffic data collection from video replaces tube counters and manual tally sheets with a recording and an AI that tracks every road user in it. You record the site with a camera or drone, upload the footage to GoodVision Video Insights and get the full trajectory of each vehicle, pedestrian and cyclist. Every count and measure you report is built from those trajectories.
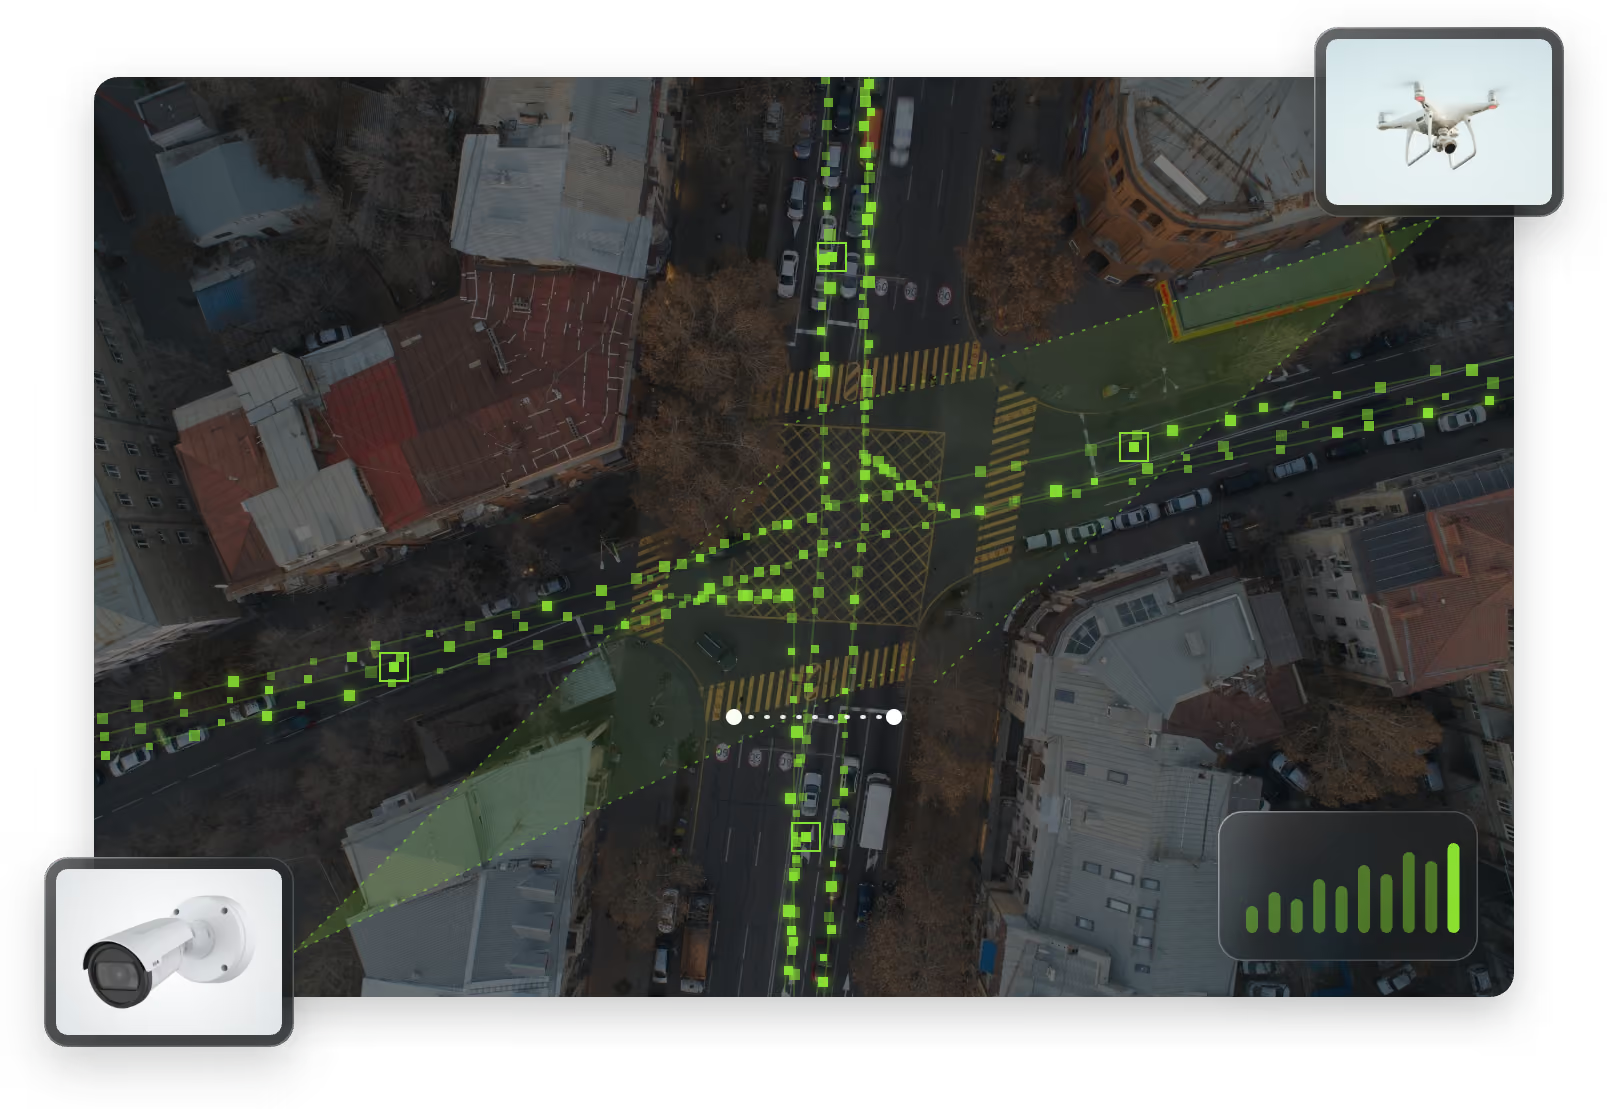
Traffic Camera
Fixed CCTV or a temporary camera mounted 5 to 30 meters up. Results within hours.
Low Drone
Drone footage from up to 30 meters, for sites with no good pole position. Results within hours.
High Drone
Drone footage from 30 to 250 meters, for a view over a whole junction. Results the same day.
One Recording, Every Road User Counted
A camera on a mast or a drone in the air records the site, and GoodVision counts every road user in the footage. You record with the cameras and drones you already own. Drone surveys run on the global classification scheme. For fixed-camera surveys, regional schemes and custom classification schemes are available on request.
What Data Comes Out of a Traffic Video?
One processed video gives you every standard survey measure from the same trajectories. You draw lines, gates and zones on the scene in the platform, and GoodVision counts and times every road user against them. These outputs are in production in Video Insights today and export to Excel.
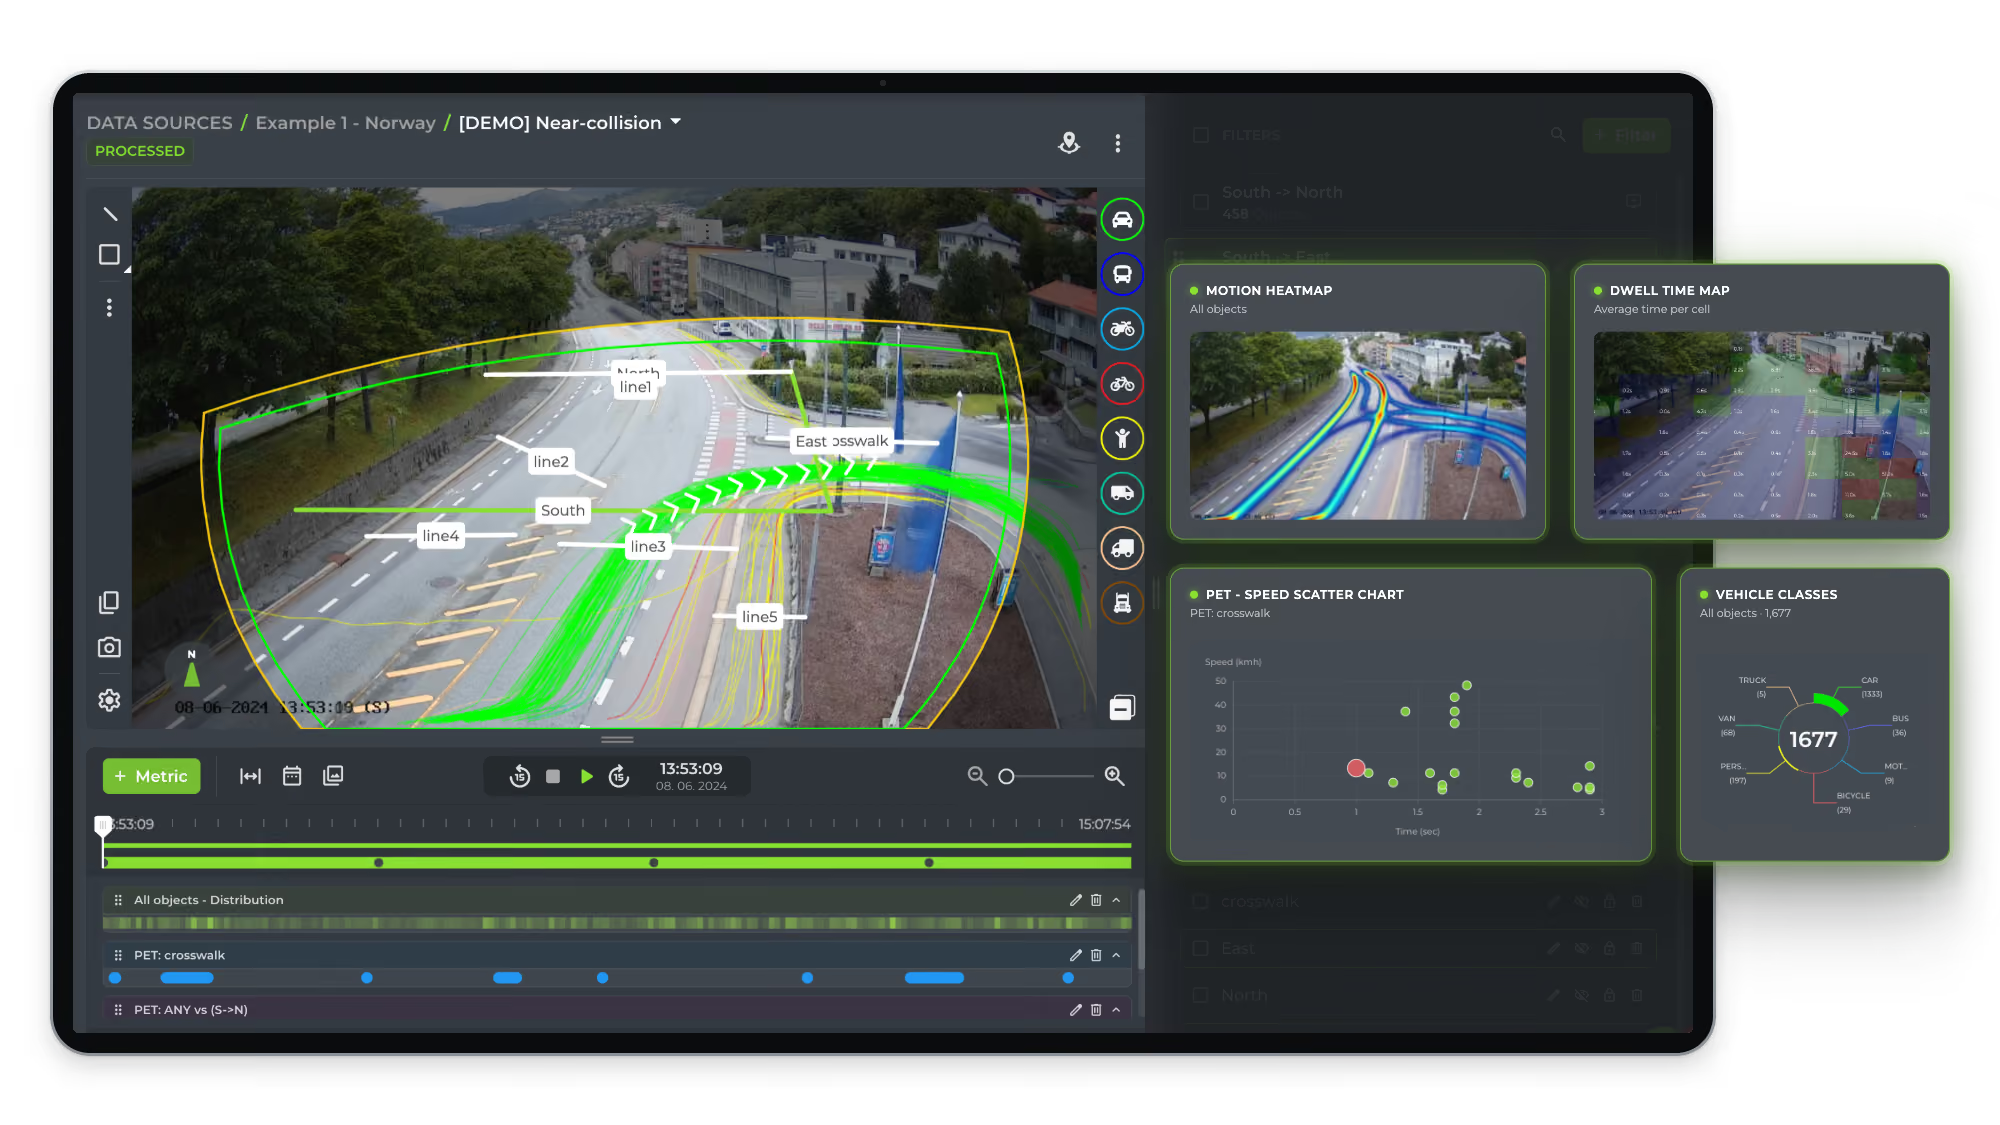
Turning Movement Counts
Classified counts for every movement you draw, at junctions, roundabouts and motorway sections. Combine several cameras into one flow overview with the Multi-Source TMC report.
Origin-Destination Matrix
Place lines at every entry and exit and GoodVision generates all the O-D movements for you, then reports them as a matrix.
Journey and Travel Time
The time road users take between two points you define, reported as mean travel time.
Delay and Queue Waiting
Occupancy time measures how long road users are held in a zone, which is the delay and queue waiting time at a stop line or merge.
Speed and Headway
Average and 85th-percentile speed, speed bins over any period, and the time gap between successive vehicles.
Full Trajectories
The path of every road user through the scene, the raw material for model calibration, behavior studies and safety analysis.
Queue Length Is a Live Traffic Measure
From recorded video you get occupancy time, which tells you how long each road user waited. Live queue monitoring, violations and incident detection run on camera streams in GoodVision Live Traffic. If a brief asks for a queue length profile from video, we will point you to Live Traffic up front.
Which Survey Reports Can You Export?
Every report exports as an Excel file in .xls format, ready to paste into your deliverable or your traffic model. You build each one from the lines and zones you drew, and you can generate as many as the project needs from a single processing run.
Count Report
Classified turning movement counts per movement and interval, the core deliverable of most junction surveys.
Multi-Source TMC
Movement counts from several feeds combined into one flow overview of a large junction or corridor.
OD Matrix
Origin-destination movements between every pair of lines you placed, as a matrix.
Vehicle List
The individual vehicles behind your counts, for audit, sampling or your own analysis.
Peak Hour and Saturation Flow
The busiest hour of the survey found automatically, and discharge rates for signal timing work.
Speed Bins
Vehicle speeds broken into predefined ranges over the period you choose.
Process Once, Report Again
Answer a late client question from the survey you already ran. Draw new movements on the footage you already processed and the new report is built from the stored trajectories. For dashboards, heatmaps and the metric and filter logic behind every report, see Traffic Data Analytics. For near-miss reports from the same footage, see Road Safety Analysis.
How Do You Get Survey Footage Processed?
You upload the video in the browser, choose the processing mode that matches how it was filmed and start work on the scene while it processes. The steps below are the practical details that keep a multi-day survey moving without re-uploads.
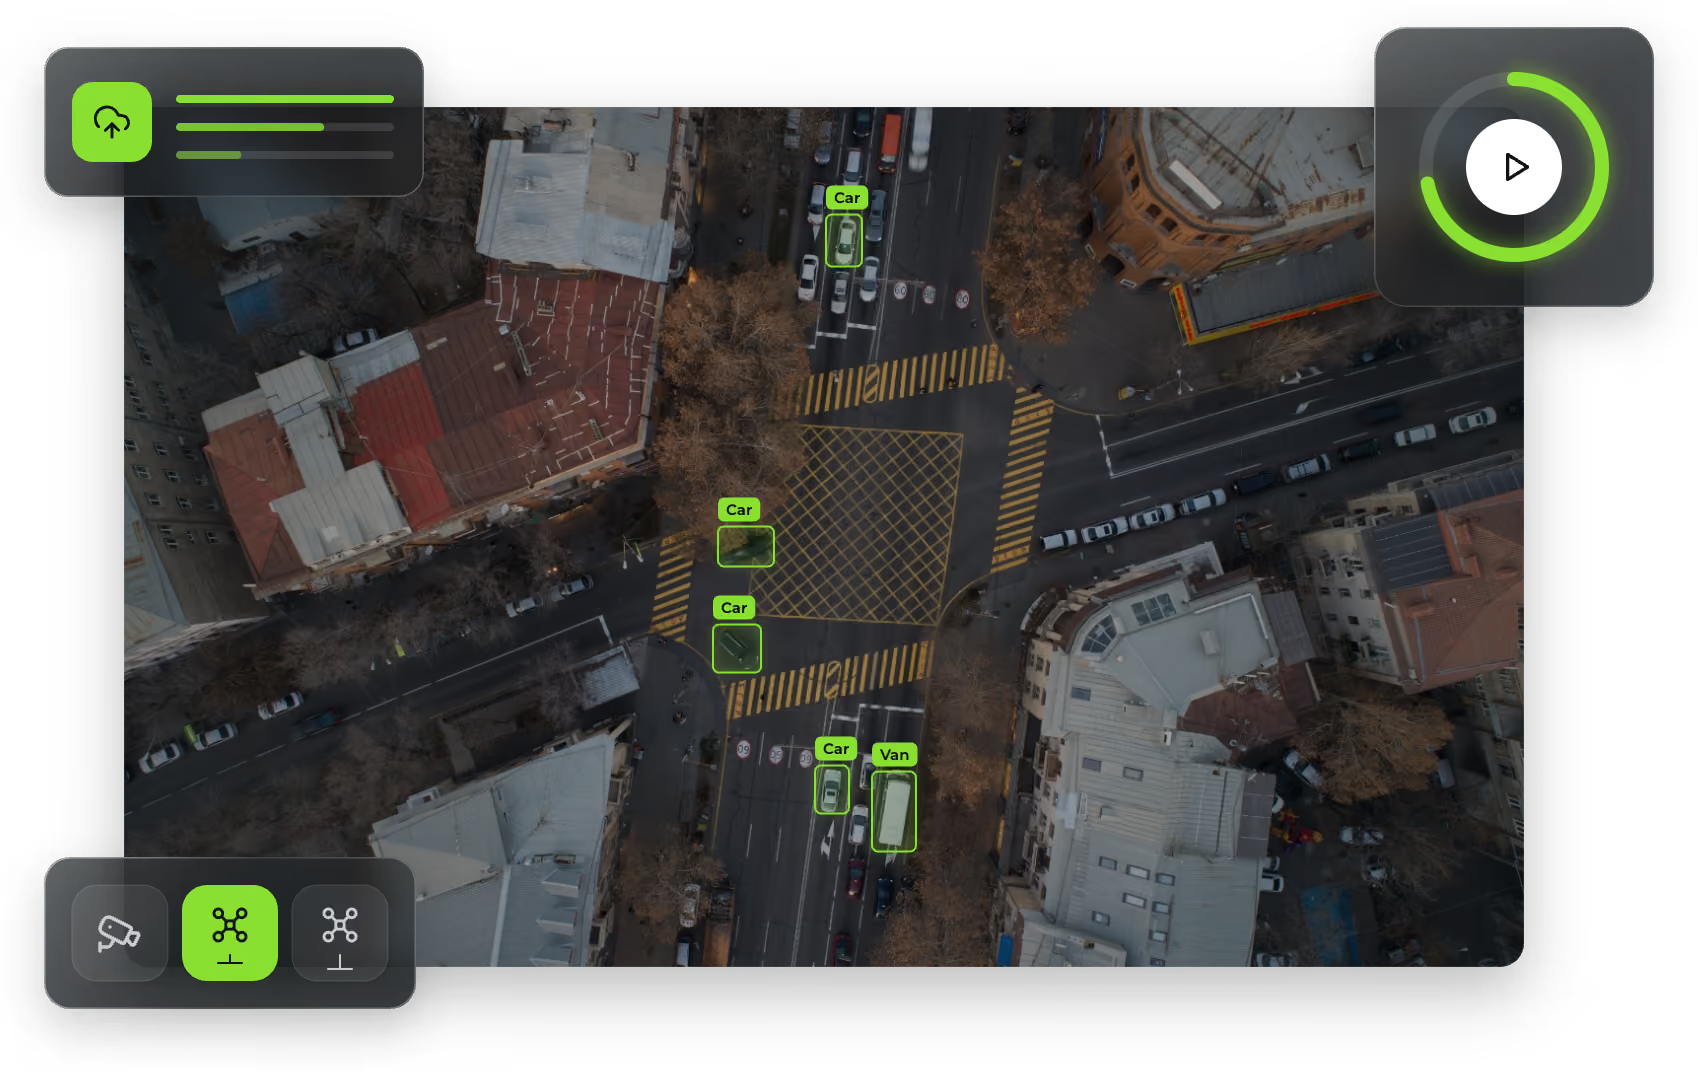
Any Recording
Video from fixed cameras, drones or any other source. Choose Traffic Camera, Low Drone or High Drone to match it.
Clean Decode
At least 95% of a video's frames must decode for processing to publish. Re-encoding usually fixes a damaged file.
Cloud Storage Sources
Video Insights accepts footage from Google Drive, OneDrive and Dropbox, as well as files from your own computer.
Process While Uploading
Footage lands in GoodVision Vault, the built-in cloud storage, and can start processing before the upload finishes.
Geo-Calibration by Support
Request calibration from the calibration screen. GoodVision Support maps the scene to real-world coordinates and notifies you when it is done.
Self-Serve or Assisted
Run the analysis yourself, or have GoodVision support staff run it in the platform and deliver the report.
Questions Surveyors Ask About Video Counts
These are the questions that decide whether video can replace your counters on the next job: accuracy, turnaround and what the footage can measure. For how GoodVision fits a consultancy as a whole, see Traffic Consultancies and Video Insights.
How Accurate Are Video Traffic Counts?
95%+ on counts and classifications, validated against manual counts. Stable, well-framed footage is what keeps it there.
How Long Does Processing Take?
Within hours for traffic camera and low-drone video. High-altitude drone video comes back the same day.
Can I Count Pedestrians and Cyclists?
Yes. Vehicles, pedestrians and cyclists come out of the same video, in the same study, with the same trajectories.
Can I Get Queue Lengths From a Recording?
No. Recorded video gives you occupancy time, the delay and queue waiting time per road user. Queue monitoring is a Live Traffic scenario on camera streams.
What Format Are the Reports?
Excel, in .xls format. Each report is built from the movements, gates and zones you defined on the scene.
Do I Need to Reprocess to Add a Movement?
No. Outputs are generated from the trajectories already extracted, so you can add movements and reports at any time.
Count Your Next Junction From Video
Send us a recording from a site you are surveying and we will show you the turning movements, the O-D matrix and the travel times it already holds.