
Predictive Traffic Analytics, Calibrated on Your Corridor
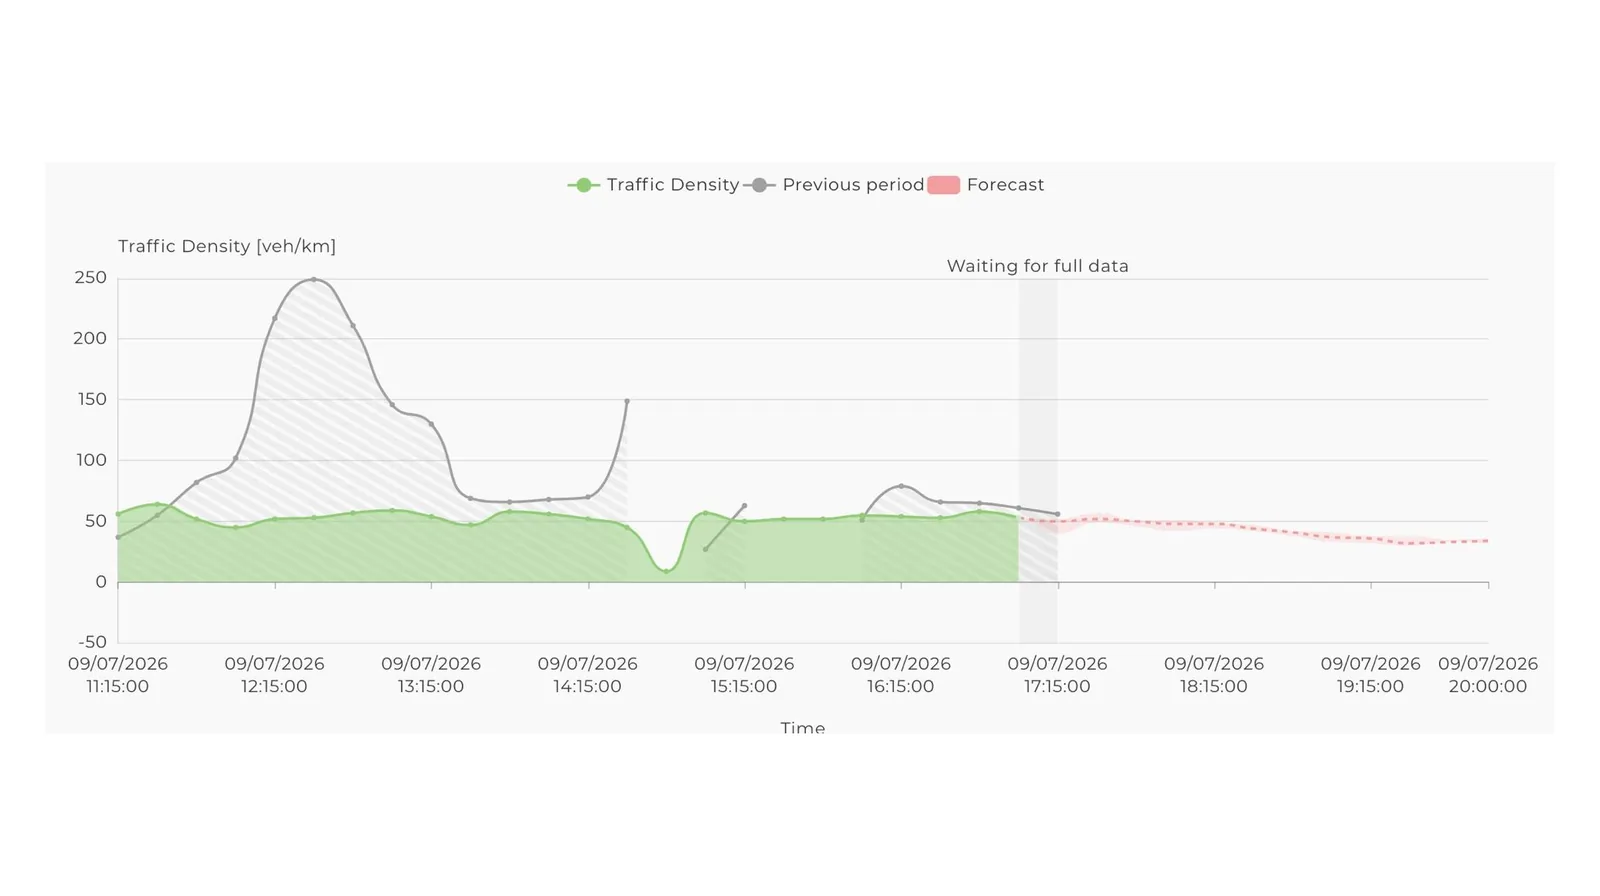
Predictive traffic analytics uses the traffic history a road has already produced to project how it will behave next. In GoodVision Live Traffic, the prediction model trains on data from your own cameras for the first three months of a deployment. Highway and tollway operators see predictions once the model is calibrated.
What Are Predictions in GoodVision Live Traffic?
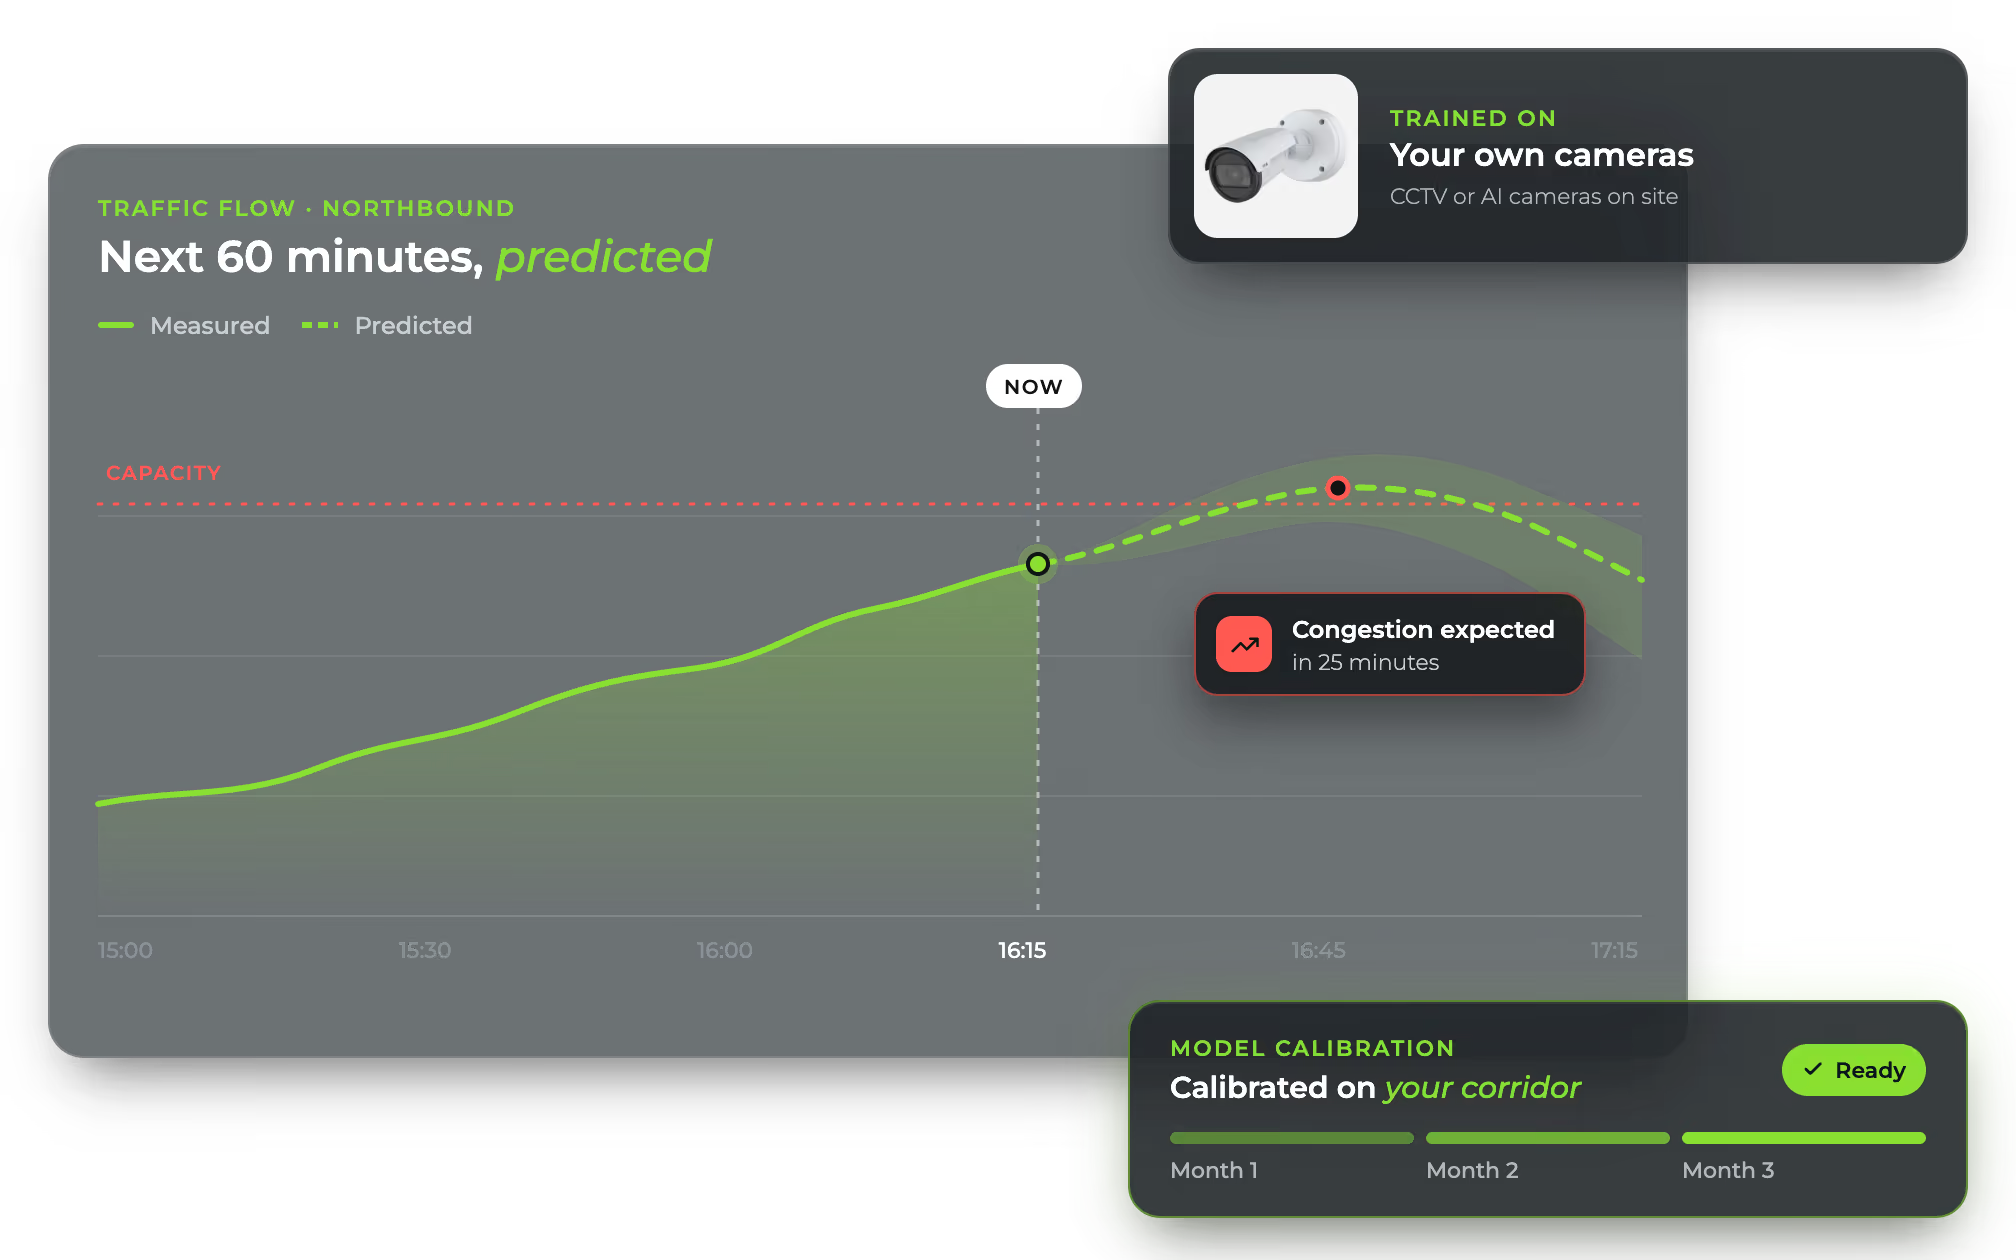
Predictions are a capability of GoodVision Live Traffic that learns from the traffic your cameras measure. It trains and calibrates on your deployment, so a prediction reflects your corridor, your lanes and your traffic patterns.
Trained on Your Data
The model learns from the counts, speeds and flow your own cameras record.
Three Months to Calibrate
The first three months of a deployment are the training and calibration period.
Visible Once Calibrated
During calibration, predictions are visible only to GoodVision staff. You see them when the model is ready.
Why Do Predictions Take Three Months?
A prediction is only as good as the history behind it. For the first three months of a deployment, the prediction model trains on your traffic, and only GoodVision staff can see its output while it calibrates. That keeps unproven forecasts away from your operators. Everything else in Live Traffic works from the day each scenario goes live.
From Day One
Live counts, flow, speed and density, plus automatic incident detection, run as soon as each scenario is configured.
Months One to Three
The prediction model trains and calibrates on your corridor. GoodVision reviews its output internally.
After Calibration
Predictions become visible in your deployment, built on three months of your own traffic history.
The Data Predictions Learn From
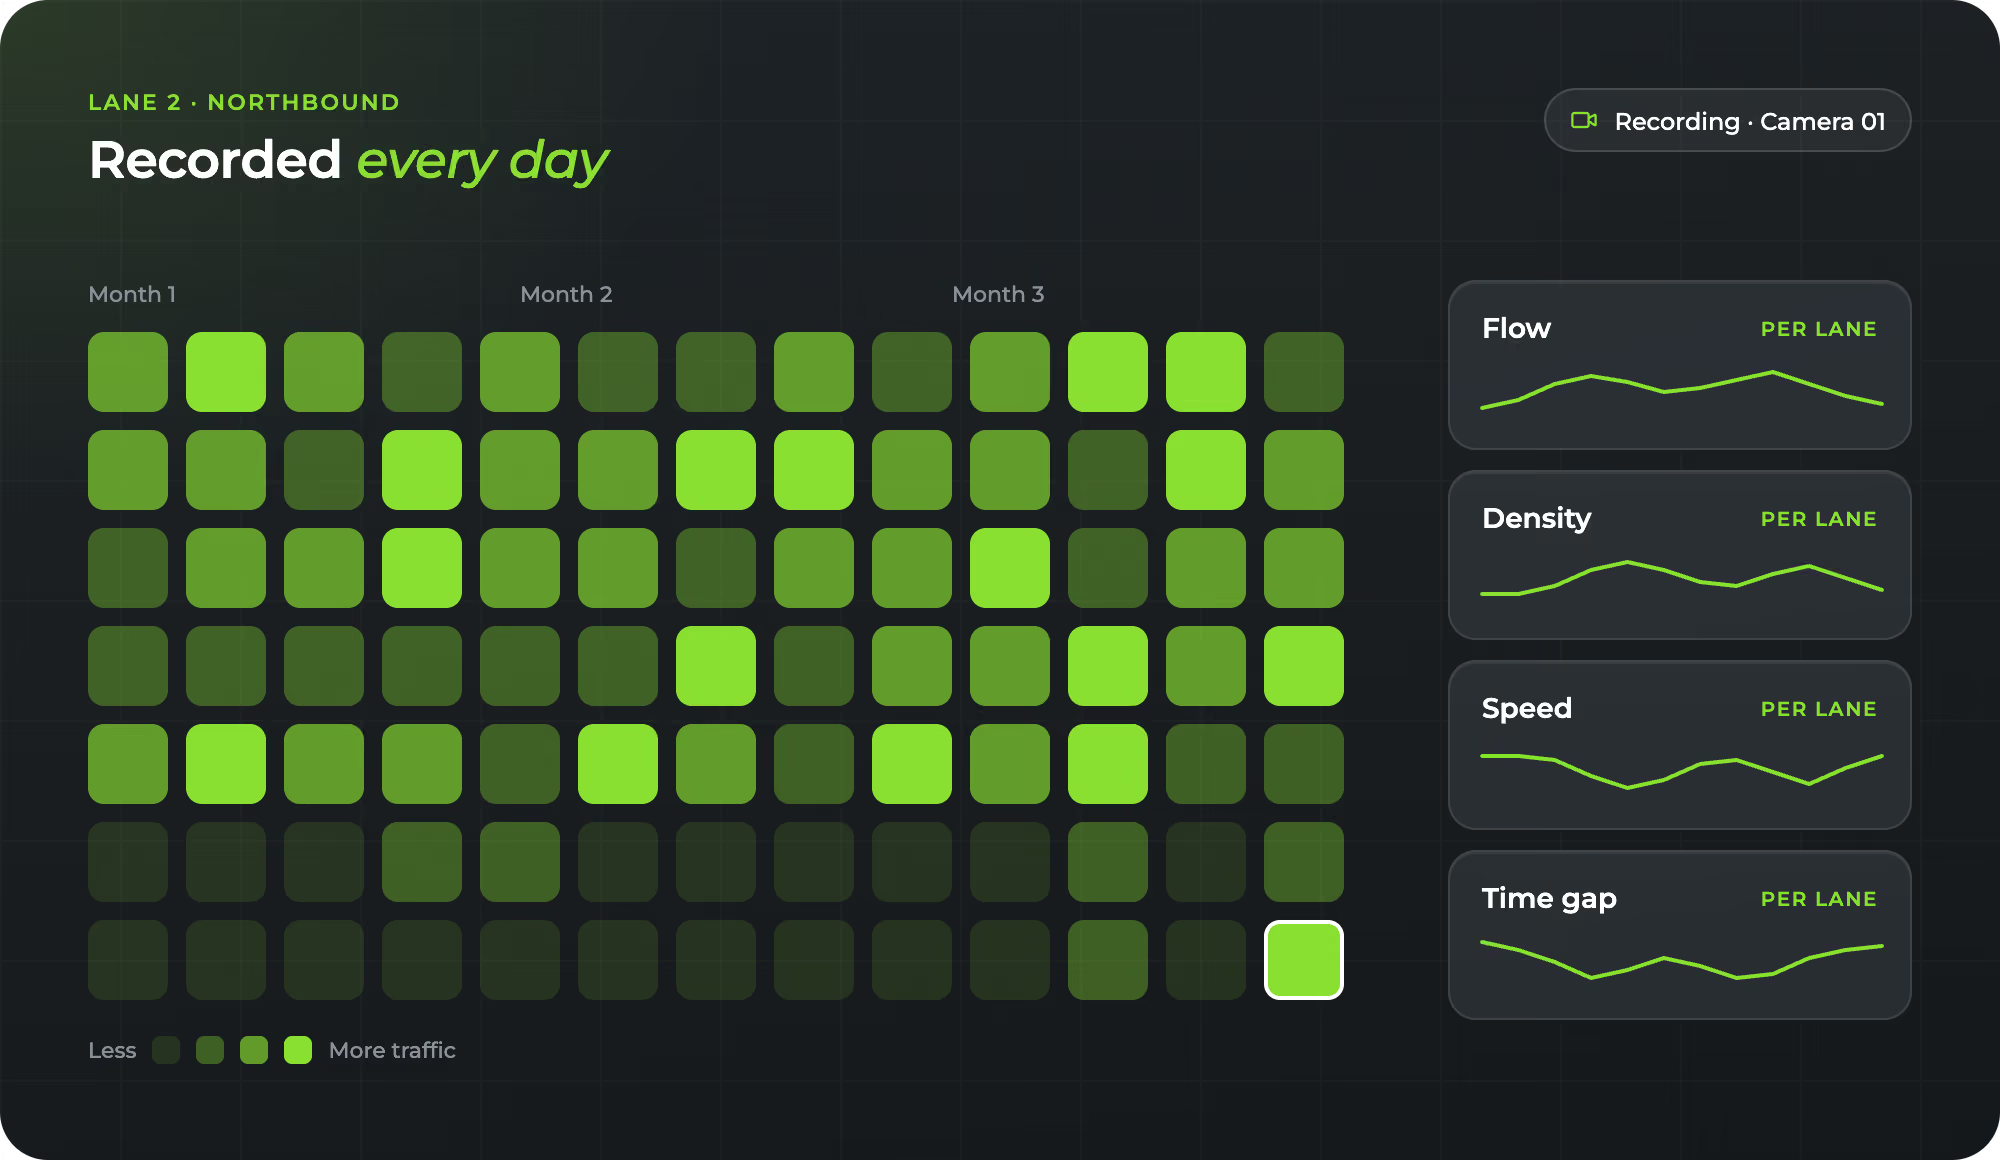
Predictions build on the same measurements that power real-time traffic monitoring. GoodVision Live Traffic records traffic flow, density, average and 85th-percentile speed and time gaps, per lane, every day of the deployment. That continuous record is the history a prediction model needs, and it is yours to keep, with or without predictions.
Flow and Density
Vehicle throughput over time and vehicle concentration per distance unit, where congestion shows first.
Speed
Average and 85th-percentile speed, per lane, measured continuously.
Time Gap
The interval between consecutive vehicles, which tightens as a lane approaches capacity.
Set Expectations Before You Buy
Plan predictions as a second-phase deliverable, and judge the model by how it forecasts your corridor once calibrated. To see how predictions fit with incident detection and toll plazas, read the highway and tollway operators page.
Start the Calibration Clock on Your Corridor
Talk to us about a Live Traffic deployment on your cameras. Detection and monitoring start on day one, and predictions follow once your model is calibrated.