
Real-Time Traffic Monitoring on CCTV or AI Cameras
Real-time traffic monitoring turns live camera streams into continuous counts, flow, speed, density and congestion levels, per lane and per direction. GoodVision Live Traffic does it on the CCTV cameras that highway operators and cities already run. You watch the data on live dashboards or pull it through the API, and each event reaches your systems in under a second.

Live Monitoring by the Numbers
What Does Real-Time Traffic Monitoring Measure?
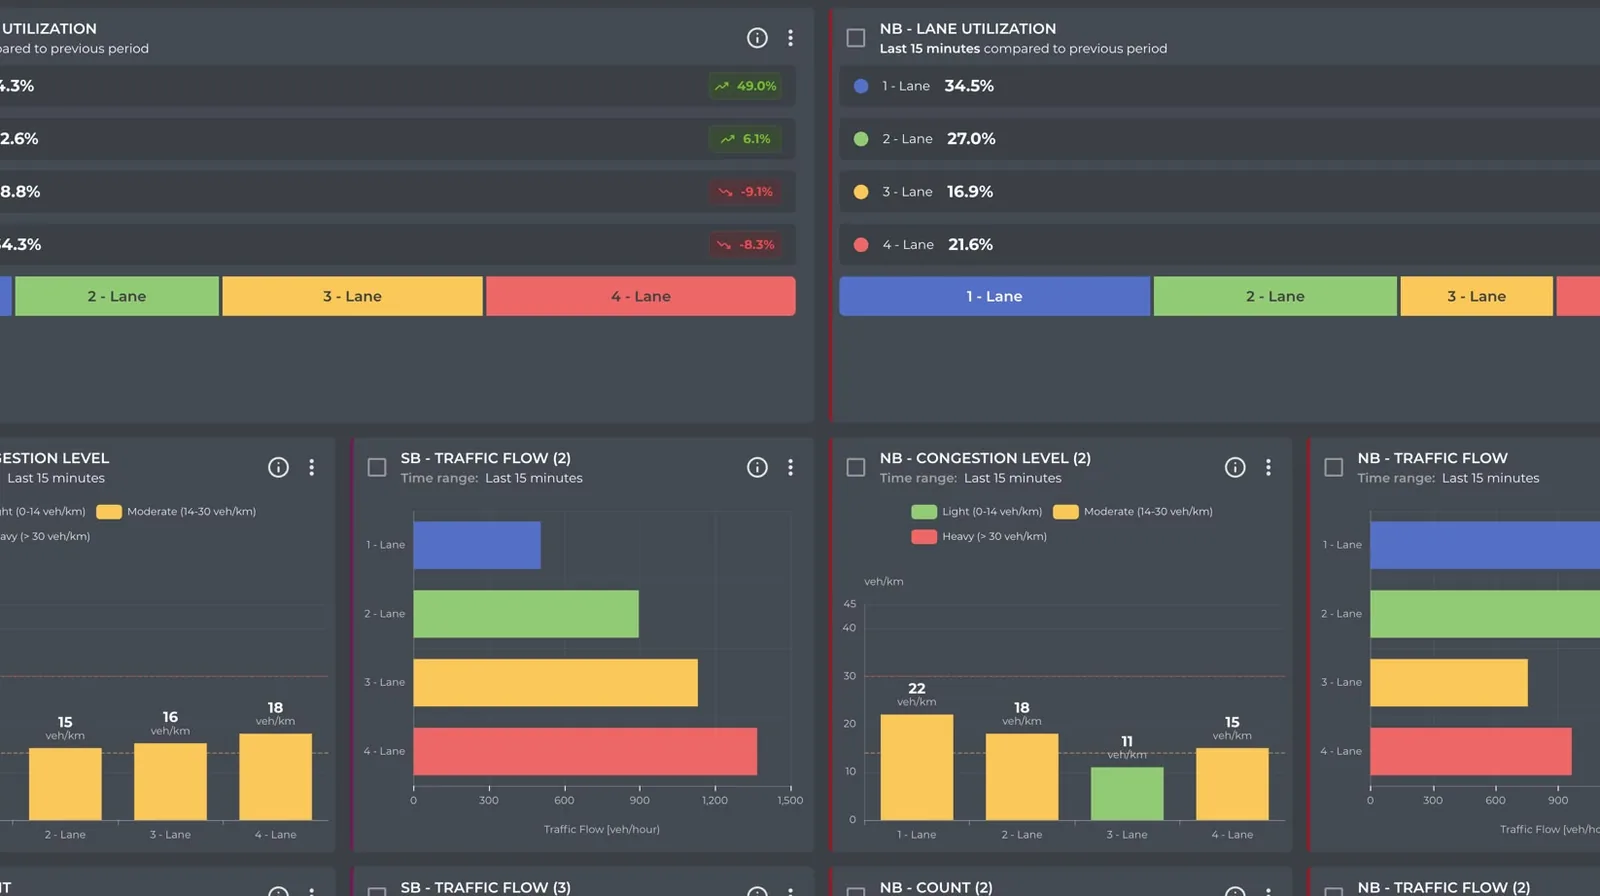
GoodVision Live Traffic detects, classifies and tracks every road user in each camera view, continuously. From those tracks it measures six things live: classified counts, traffic flow, speed, density, time gaps and congestion level. Each one is available per lane and per direction, so you see where on the road a change starts.
Classified Counts
Vehicles, bicycles and pedestrians counted per lane, approach and zone, across any line you draw.
Traffic Flow
Vehicle throughput over time, to find peak hours and see how close the network runs to capacity.
Speed
Average speed and 85th-percentile speed, the speed 85% of vehicles travel at or below.
Density
Vehicle concentration per distance unit, which is where bottlenecks and congestion show first.
Time Gap
The interval between consecutive vehicles, a measure of following distance and tailgating risk.
Congestion Level
Congestion reported for each lane, banded Light, Moderate and Heavy.
Monitor the Whole Network
A loop or a radar measures one spot. GoodVision Live Traffic monitors entire road networks from the cameras already on them, and scales from a single camera to thousands. Because it is camera-agnostic, you use cameras of any brand and skip in-road sensors.
How Do You See the Data Live?
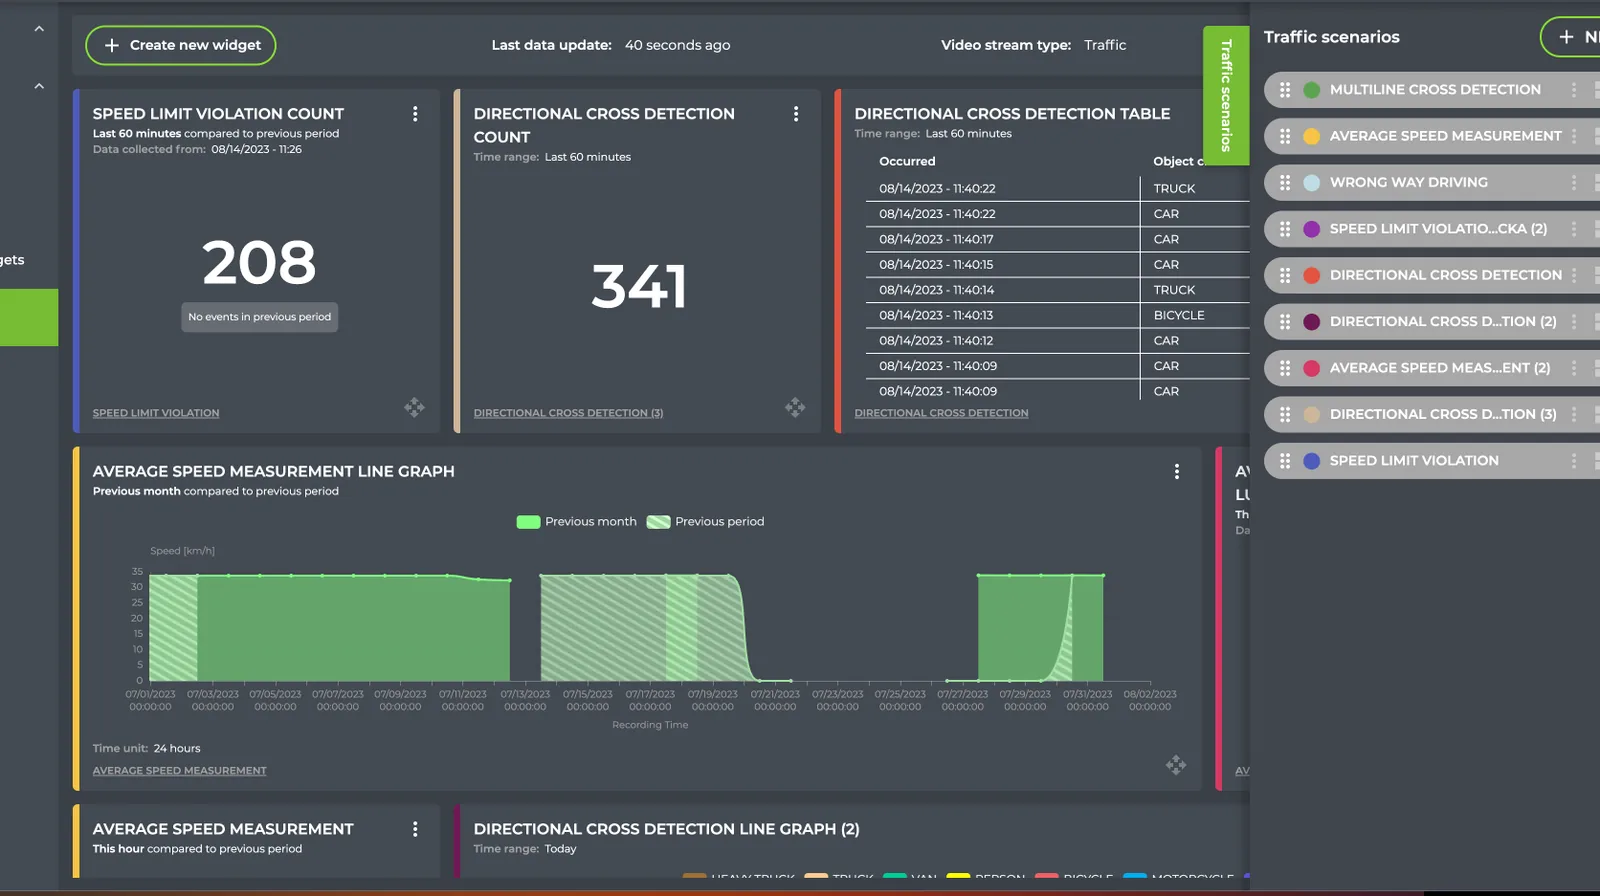
In GoodVision Live Traffic, every widget and report starts from a traffic scenario configured on a camera. You pick the scenario, choose how to show it and set the time range. The same data flows to live dashboards, to .xls reports and to the REST API, so operators, analysts and your own systems all read one source.
Scenario First
Configure a scenario on a camera, such as directional or multiline cross detection, and its data categories become available.
Chart Types
Show counts as a single value, a pie graph, a bar graph or a line graph. Events appear as a table.
Time Ranges
Rolling windows, current periods, previous and comparative periods, or a custom range from 15 minutes to 31 days.
Reports in .xls
Count, Event, Average Speed, 85th Percentile Speed, Average Time Gap, Traffic Flow and Traffic Density reports.
Or Skip the Dashboards
The REST API serves vehicle counts, average speeds, occupancy and every other extracted parameter. Aggregate from 1 second to 24 hours, filter by object class and by lane, and pull image snapshots for detected events. Dashboards are optional if your traffic management system is where your operators work.
Real-Time Monitoring on Highways and Toll Roads
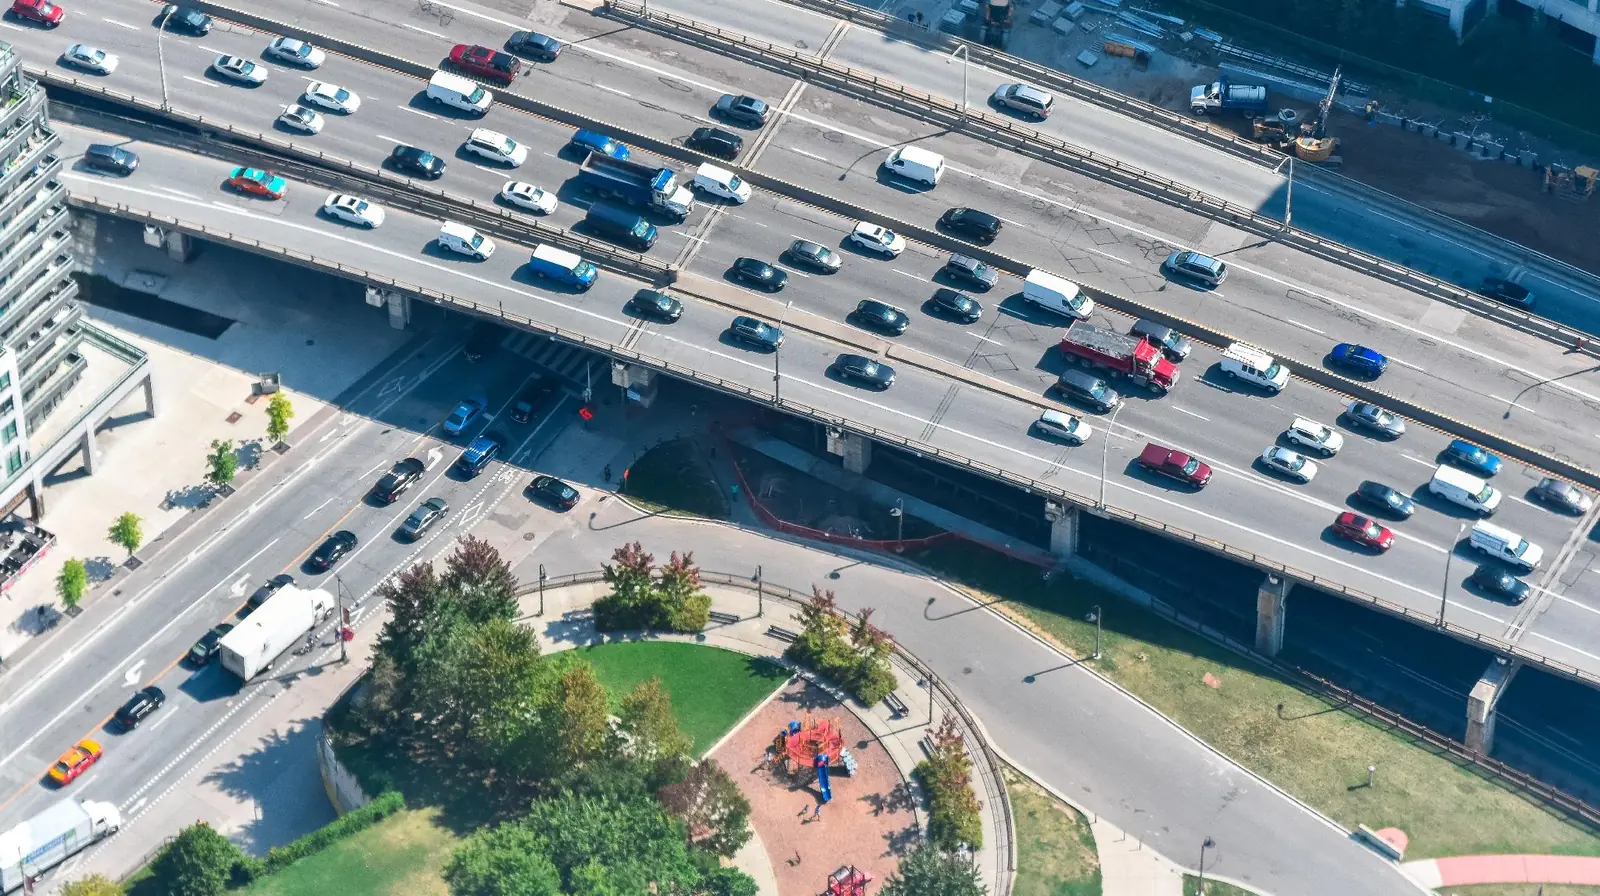
On a highway, real-time monitoring turns each camera into a permanent monitoring station. Highway flow monitoring reports average and 85th-percentile speed, time gap, flow and density per lane, every day of the year. The same cameras watch toll lanes and raise incidents, as the highway and tollway operators page describes.
Highway Flow Monitoring
Speed, time gap, flow and density per lane, exported as reports or pulled through the API.
Toll Lane Capacity
Toll lane capacity monitoring tracks each lane at the plaza, and lane status and capacity events are queryable through the API.
Incidents on the Same Cameras
Wrong-way drivers, stopped vehicles and congestion, raised as live events by automatic incident detection.
Real-Time Monitoring for Cities and Intersections
In a city, the same live data comes from junction and street cameras. GoodVision counts vehicles, bicycles and pedestrians per approach, per movement and in zones, live. It integrates through APIs with signal controllers, smart city platforms and traffic operations dashboards. The cities and municipalities page covers the full intersection picture.
Counts per Approach
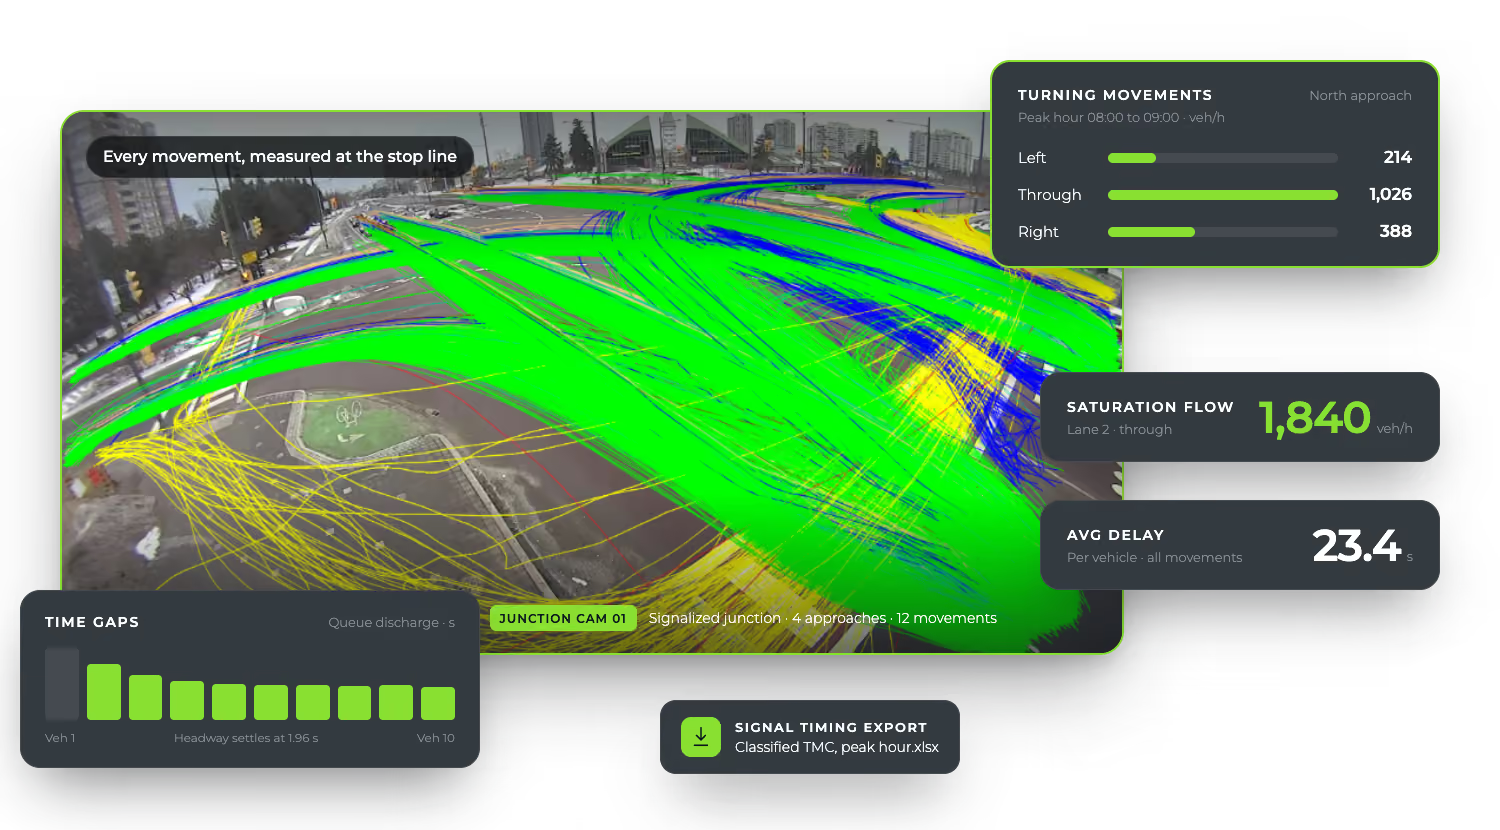
Directional and multiline cross detection count each movement through the junction as it happens.
Every Road User
Vehicles, bicycles and pedestrians in the same view, so the most vulnerable road users are counted too.
Into Your Controllers
Live data to signal controllers and traffic management systems over the API. See intersection monitoring.
Questions About Real-Time Traffic Monitoring
These answers cover what highway operators and city traffic teams ask first about real-time monitoring: which cameras it needs, where processing runs, how it differs from recorded-video analysis, how much history you keep and how the data reaches your own systems. Each answer is short and gives you the numbers behind it.
Does It Work With the Cameras We Already Have?
In most cases, yes. GoodVision reads standard RTSP streams in H.264 or H.265, from 640x480 up to 1920x1080, at 10 to 50 frames per second. Vehicles need to fill at least 5% of the camera view. GoodVision works with cameras of any brand.
Where Does the Processing Run?
On an edge device next to your cameras, on your own GPU server, or inside a supported AXIS® camera with a DLPU. GoodVision is software, so you choose the hardware.
How Is This Different From Video Insights?
Live Traffic monitors live streams continuously. GoodVision Video Insights analyzes recorded video for surveys and studies. Data from both lives on the same platform.
How Accurate Are the Counts?
95%+ on counts and classifications, validated against manual counts. The platform runs in all weather and lighting conditions.
How Long Is the Data Kept?
Standard data storage is included with each license. You can increase storage on demand and choose a different retention period.
How Often Can We Pull Data From the API?
Aggregate any period from 1 second to 24 hours. Polling limits are set to fit your integration.
See Live Monitoring on Your Own Cameras
Send us a stream or a recording from one of your cameras and we will show you the counts, speeds and events GoodVision measures in it.