
Traffic Data From Recorded Video, Within Hours
GoodVision Video Insights is a cloud service that turns recorded traffic video into classified counts, turning movement counts, origin-destination matrices, speeds and full trajectories. It is built for traffic surveyors, modelers, consultancies and city planners. You upload footage from fixed cameras or drones, draw the movements you need and export Excel reports. Traffic camera footage comes back within hours.
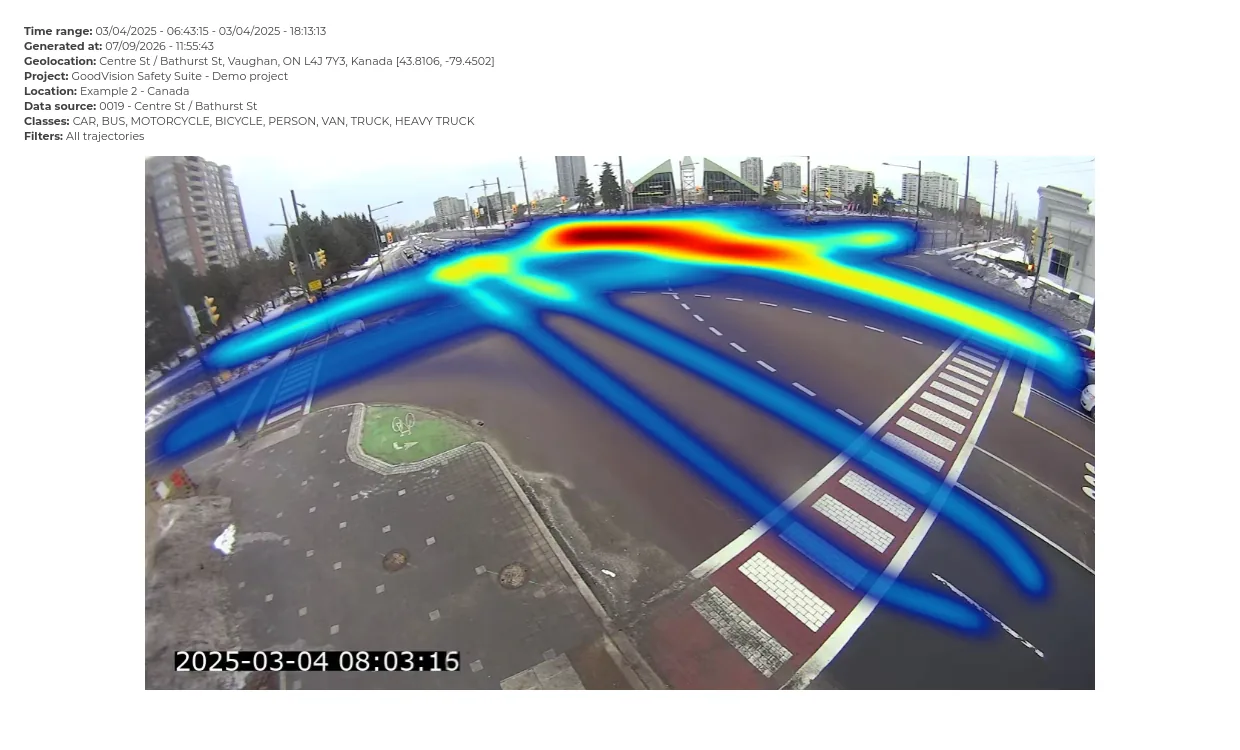
Video Insights by the Numbers
What Is GoodVision Video Insights?
GoodVision Video Insights is the recorded-video product of the GoodVision platform. Its AI tracks every vehicle, pedestrian and cyclist in your footage and stores the full trajectory of each one. Every count, speed and report you build comes from those trajectories, so you process a video once and ask it new questions whenever a project needs them.
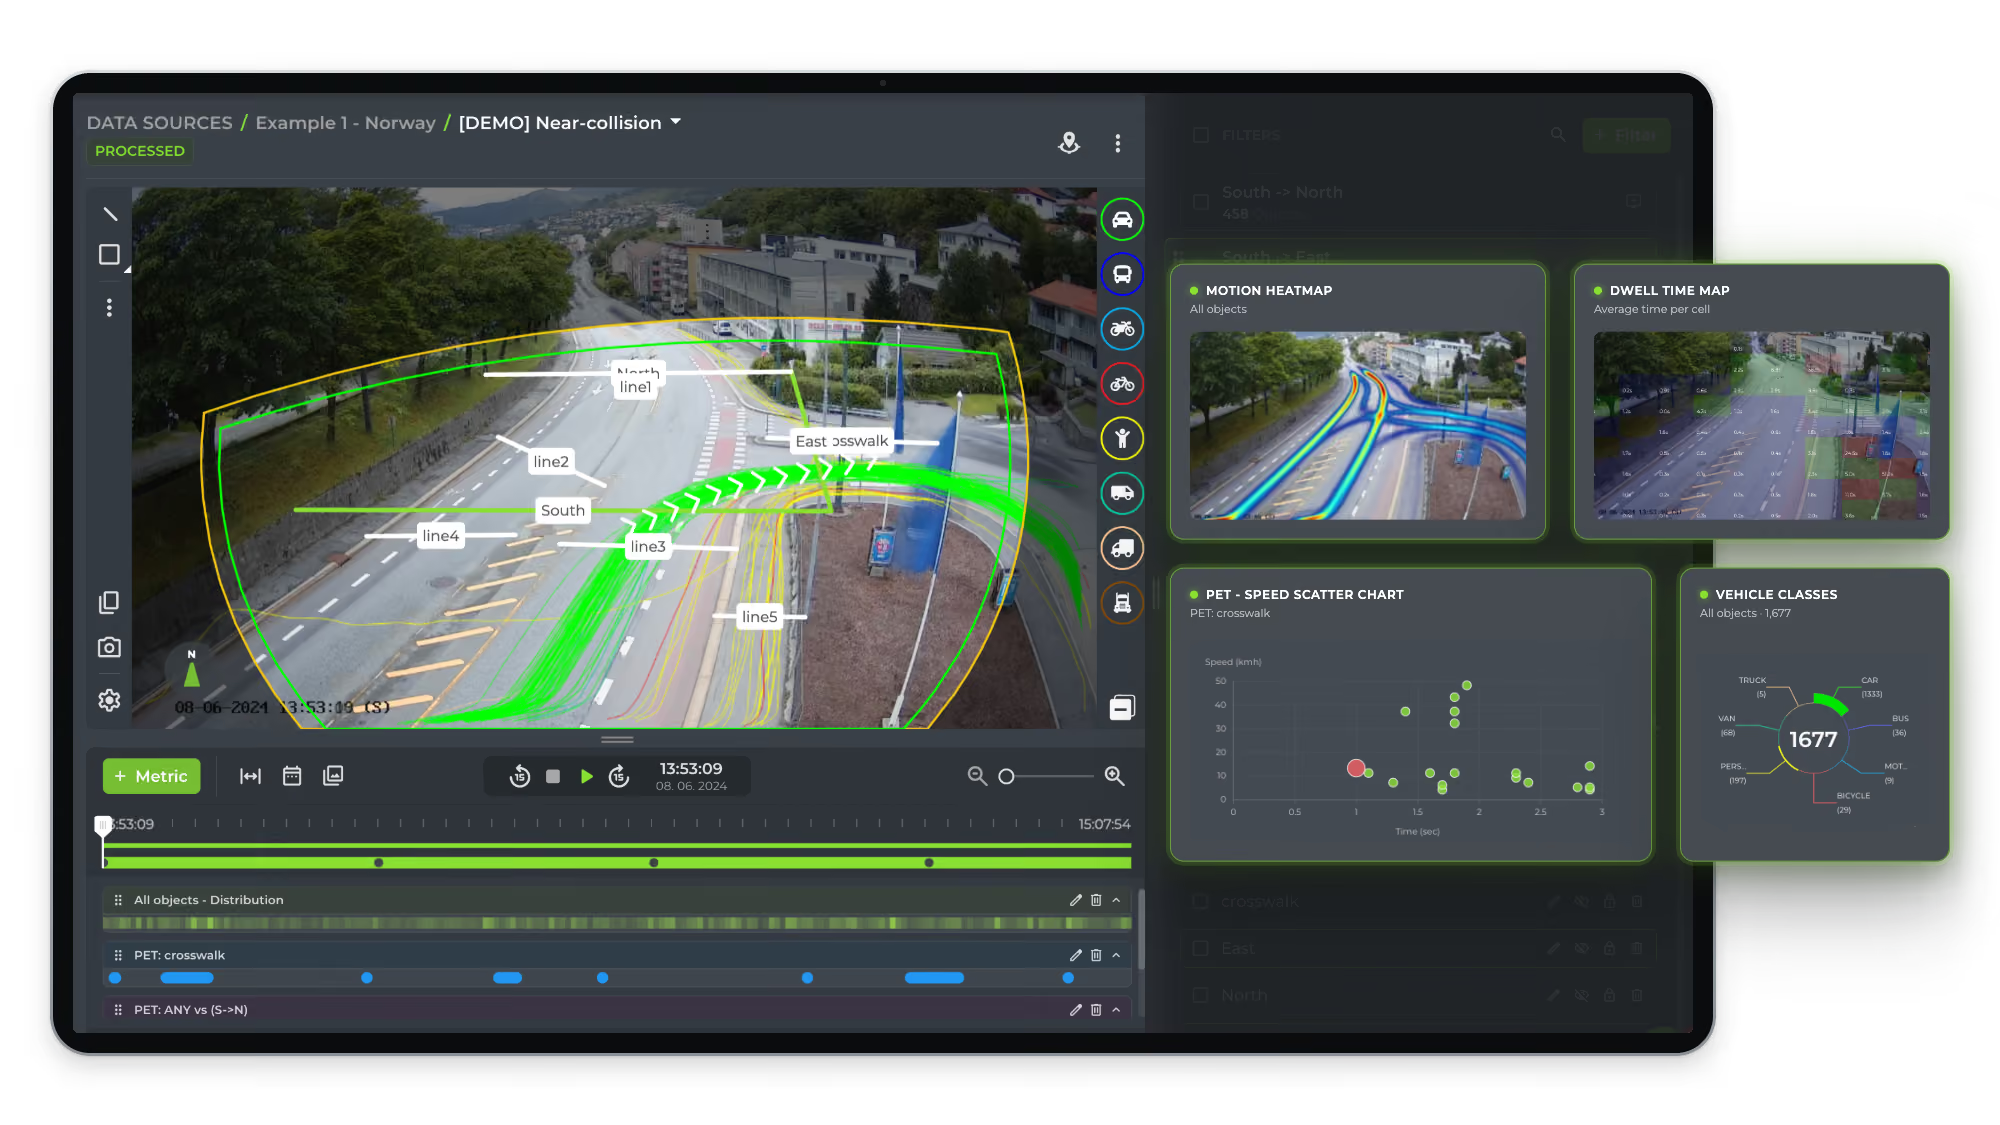
Surveyors Replace Manual Counts
Upload footage from fixed cameras or drones and get classified counts and turning movements without a person watching every hour of video.
Modelers Calibrate From Measured Data
Export origin-destination matrices, travel times and speeds as Excel reports, so model calibration starts from measured traffic.
Teams Share One Dataset
Surveyors, modelers and clients work from the same processed video instead of passing spreadsheets back and forth.
How Does Video Insights Work?
Video Insights works in four steps: upload, process, describe the scene and analyze. You upload recorded video, GoodVision AI extracts the trajectory of every road user, you draw the lines, gates and zones you care about, and the platform builds counts, widgets and reports from them. Every later step works from the extracted trajectories.
1. Upload Your Footage
Upload video from fixed cameras, drones or any other source in the browser, or bring it in from Google Drive, OneDrive or Dropbox.
2. AI Extracts Trajectories
GoodVision AI detects, classifies and tracks every road user and stores its full trajectory. You pick the processing mode that matches how you filmed.
3. Describe the Scene
Draw directional lines, zones and gates on the scene, or place lines at every entry and exit and let GoodVision generate all the O-D movements.
4. Analyze and Export
Build dashboards from 16 widgets and export .xls reports. Add a movement later and the new result comes from the stored trajectories.
Three Processing Modes
Choose the mode that matches how the video was filmed:
- Traffic Camera: mounted 5 to 30 meters up, results within hours
- Low Drone: filmed from up to 30 meters, results within hours
- High Drone: filmed from 30 to 250 meters, results the same day
What Data Does Video Insights Produce?
Video Insights produces the standard traffic survey measures from the same trajectories: classified turning movement counts, origin-destination matrices, travel times, occupancy time, speeds, headways and the full path of each road user. Vehicles, pedestrians and cyclists come out of the same study. Every output below is in production today.
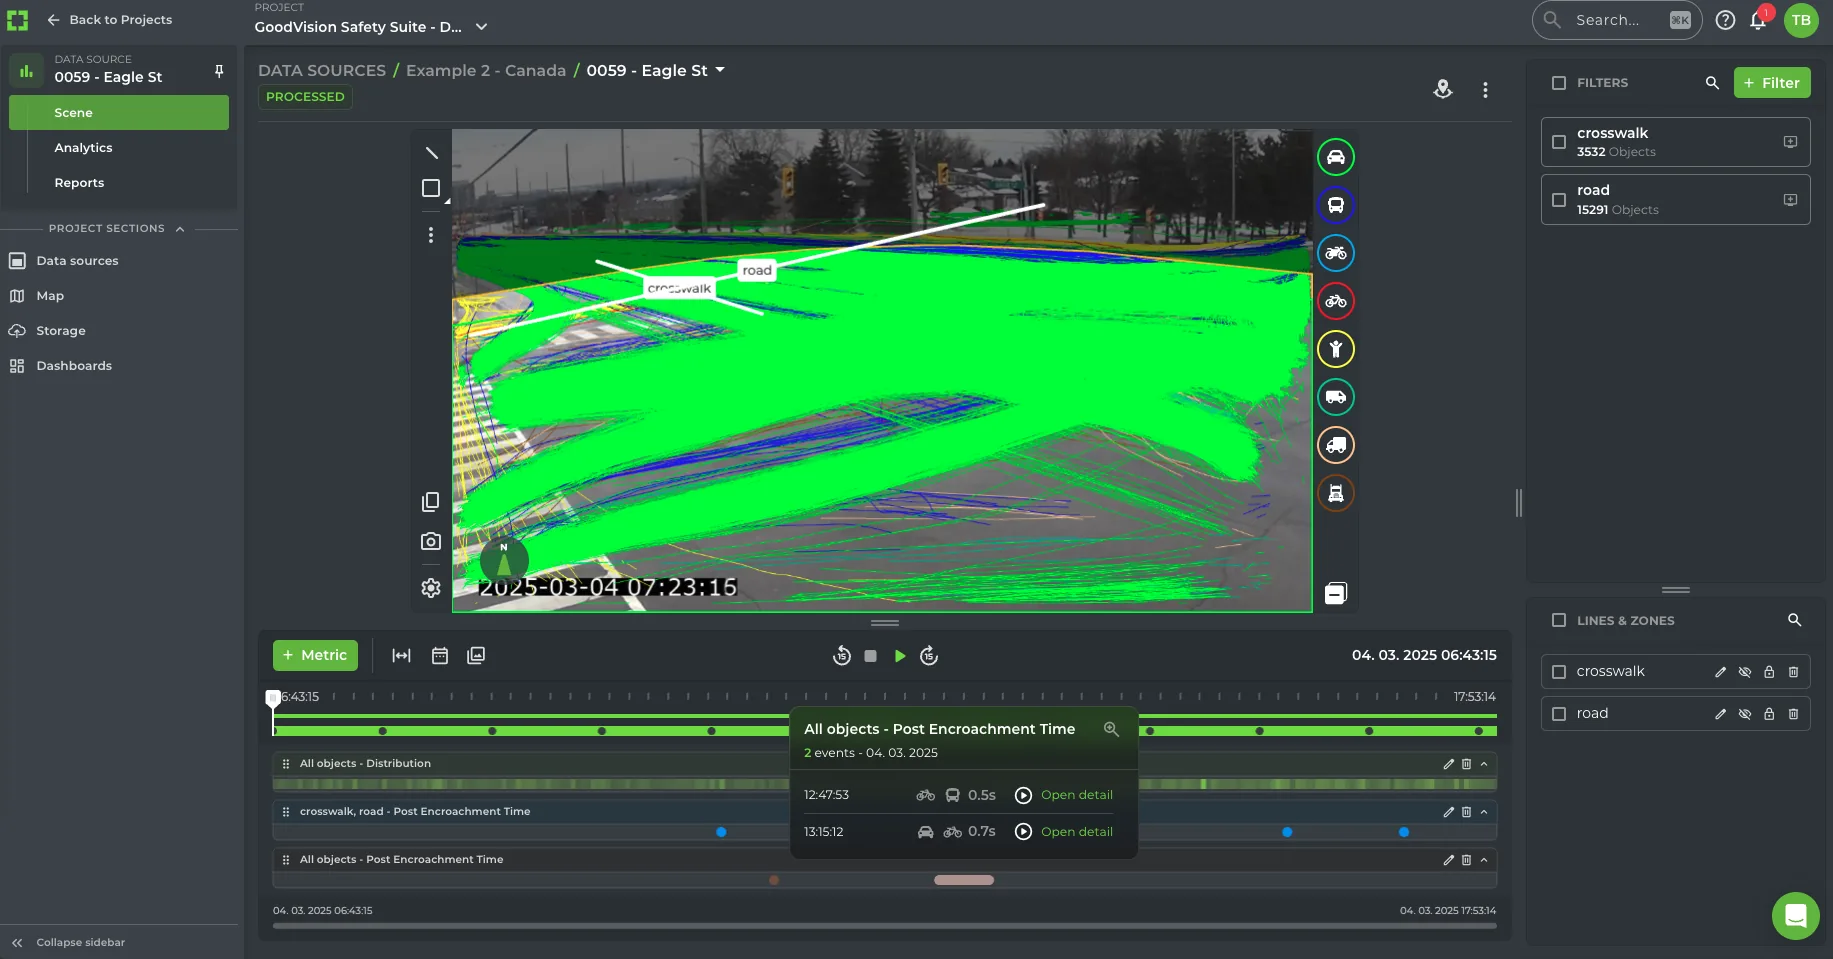
Turning Movement Counts
Classified counts for every movement you draw, at junctions, roundabouts and motorway sections.
Origin-Destination Matrix
Lines at every entry and exit, with all O-D movements generated for you and reported as a matrix.
Travel and Occupancy Time
Mean travel time between two points, plus occupancy time, which is the delay and queue waiting time in a zone.
Speed and Headway
Average and 85th-percentile speed, speed bins over any period and the time gap between successive vehicles.
Full Trajectories
The path of every road user through the scene, the raw material for model calibration, behavior studies and safety studies.
Near-Miss Metrics
Post-encroachment time and time to collision from the Traffic Safety Suite, with the video evidence for each event.
Live Measures Belong to Live Traffic
Queue length, incident detection and congestion levels run as live scenarios in GoodVision Live Traffic. For a full survey workflow from filming to deliverable, see Traffic Data Collection.
Which Reports and Dashboards Can You Export?
Video Insights exports nine self-serve reports in Excel .xls format and offers 16 dashboard widgets. Each one is built from a metric and its filters, so a report is as specific as the movements you defined. You can generate as many reports as a project needs from one processing run.
Count Report and Multi-Source TMC
Classified turning movement counts per movement and interval, and counts from several feeds combined into one flow overview.
OD Matrix and Vehicle List
Origin-destination movements as a matrix, and the individual vehicles behind every count.
Peak Hour, Saturation Flow and Speed Bins
The busiest hour found automatically, discharge rates for signal timing work and speeds broken into ranges.
PET and TTC Safety Reports
Near-miss events scored by post-encroachment time and time to collision, from the Traffic Safety Suite.
Visual Maps
Trajectories, motion, acceleration and hold-up heatmaps, collision points and a Sankey diagram of traffic flows.
Gap Acceptance Analysis
An Excel report that GoodVision Customer Success produces for you from your processed video.
Go Deeper on Analytics
For the metric and filter logic behind every widget, see Traffic Data Analytics. For near-miss studies from the same footage, see Road Safety Analysis.
What Is GoodVision Vault?
GoodVision Vault is the secure cloud video storage built into Video Insights. You upload footage to Vault by drag and drop, organize it in folders, play it back and inspect its metadata. Vault can start processing a video while it is still uploading, and it holds the footage behind every event you review.
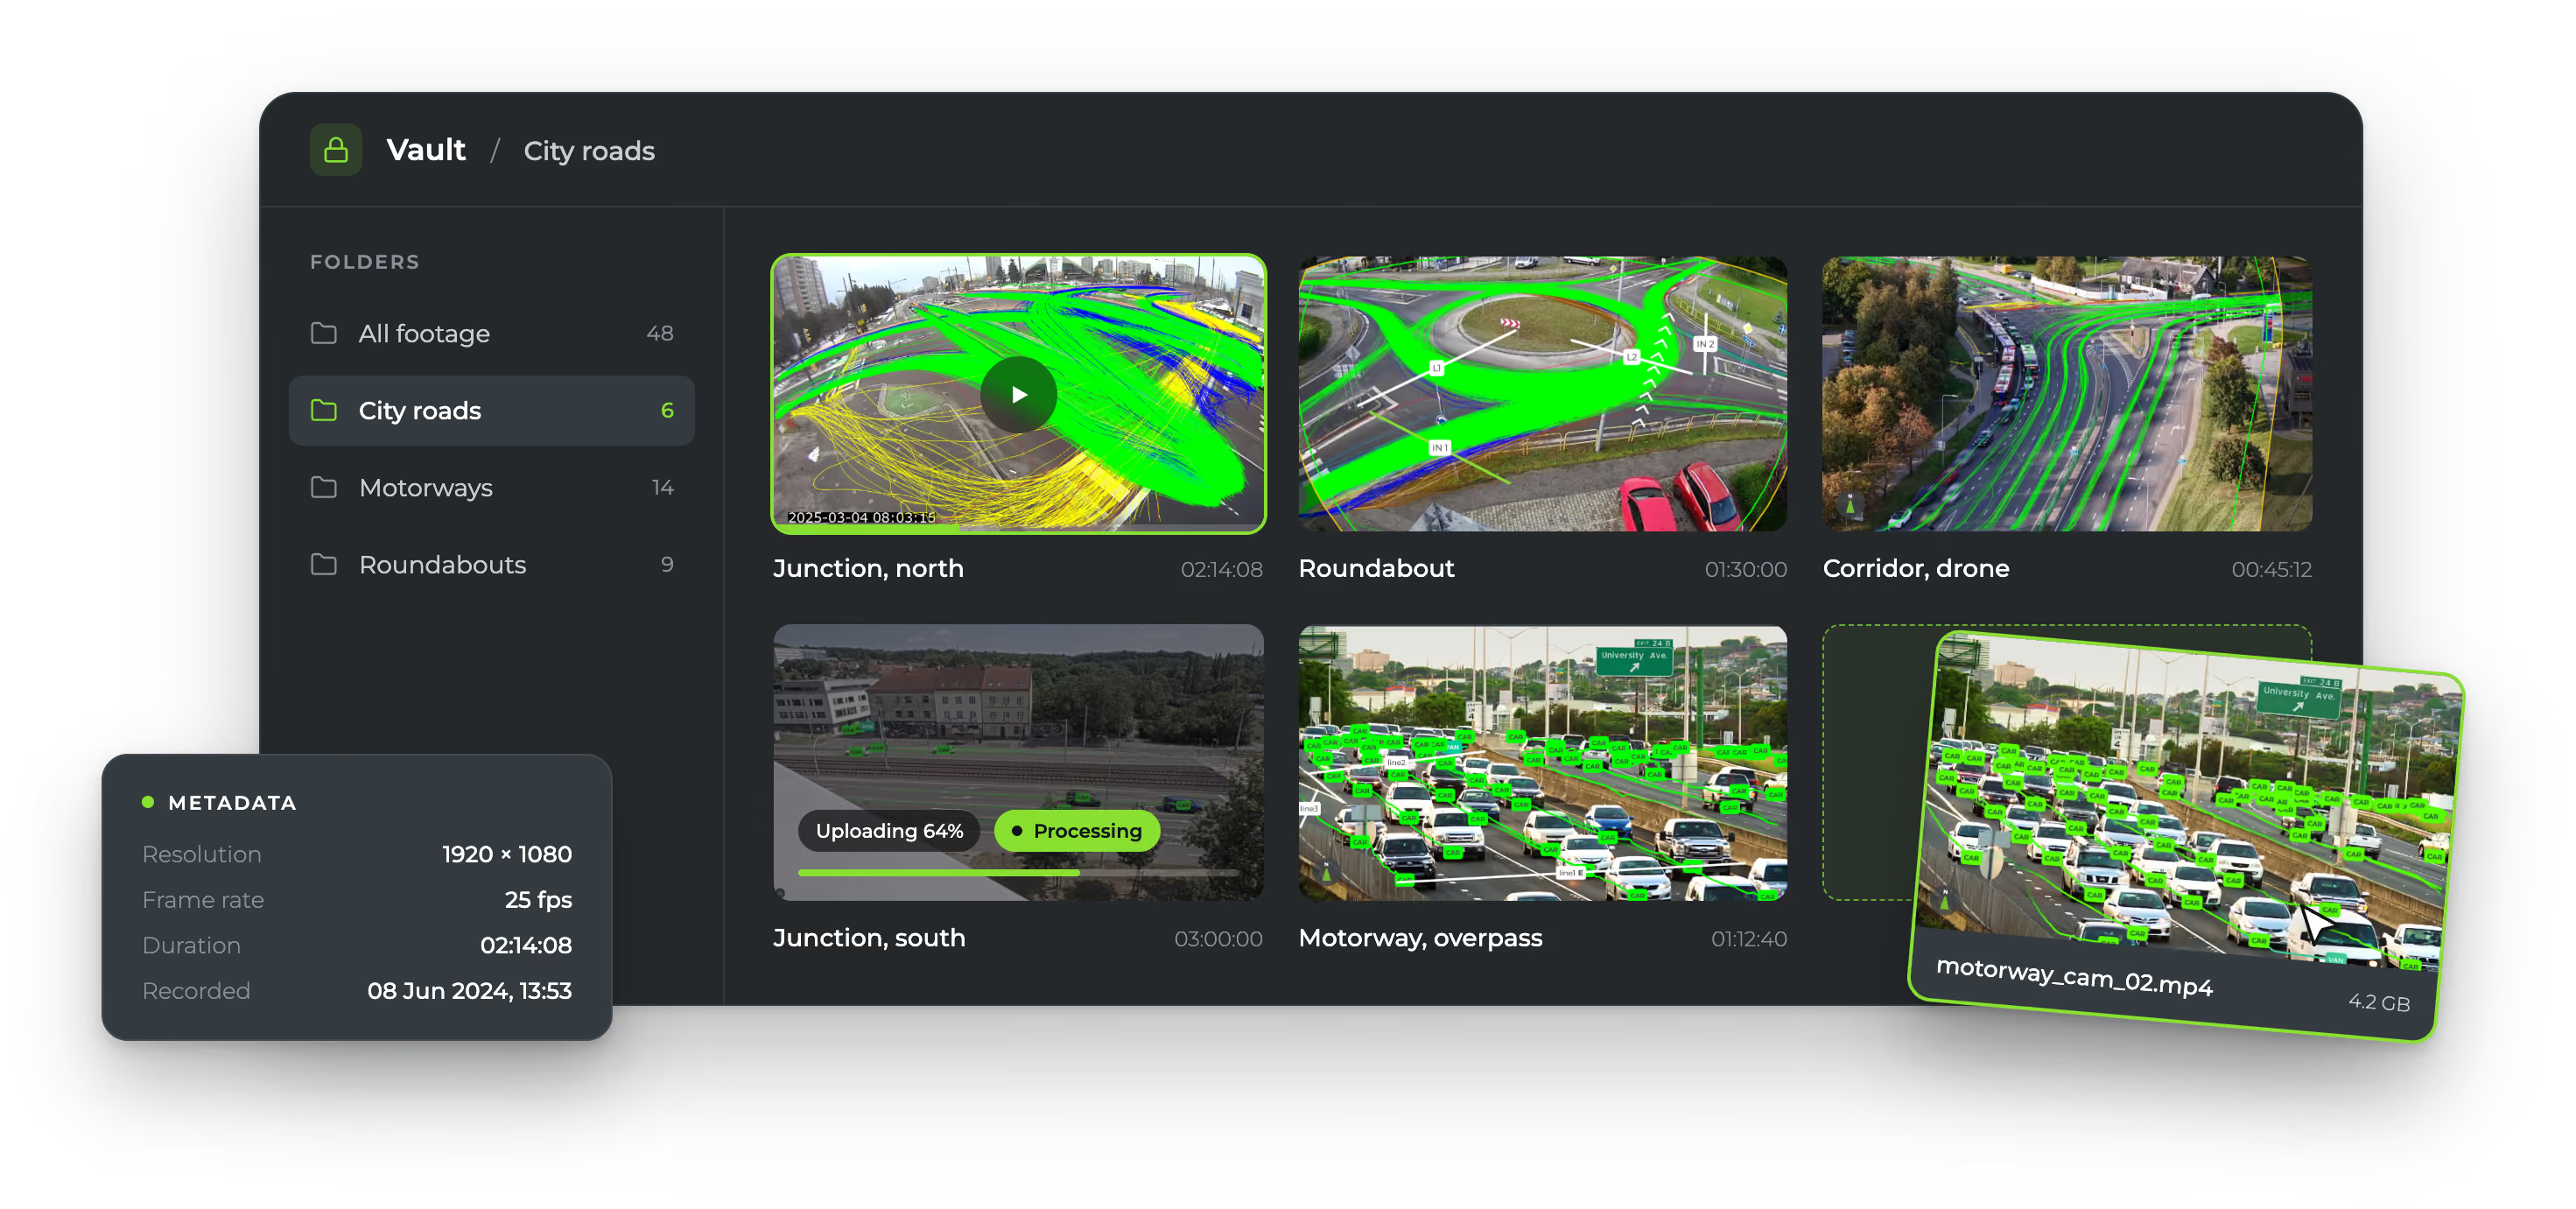
Process While Uploading
Start processing footage before the upload finishes, so a multi-day survey keeps moving.
Playback Linked to Data
Open a data point in a widget and review the video behind it. Vault is what makes that event review possible.
Automatic Re-Encoding
Drone and safety survey videos are re-encoded in the cloud after upload, which keeps them playable in the browser and compresses large drone files.
Storage That Grows
Every plan includes Vault storage, and you can add more by the terabyte when a project needs it.
Footage From Your Cloud Storage
Video Insights accepts footage from Google Drive, OneDrive and Dropbox, as well as uploads from your computer. All data is encrypted and protected with premier security.
Who Uses GoodVision Video Insights?
Video Insights serves teams that work from recorded video: traffic consultancies and survey firms, transport modelers, city traffic departments and universities. Consultancies use it for counts and model inputs, cities for intersection and safety studies, and researchers for teaching and traffic research. Each card links to the page for that team or capability.
Traffic Consultancies
Turning movement counts, O-D matrices and model inputs from your own survey footage, delivered within hours.
Cities and Municipalities
Intersection studies and safety analysis from the cameras and drones you already use.
Road Safety Analysis
Near-miss studies scored by PET and TTC, 90% faster than reviewing the video by hand.
Universities and Research
Video Insights for traffic research and teaching. See how universities work with GoodVision.
Questions About Video Insights
These answers cover what surveyors, modelers and planners ask before their first project: accuracy, turnaround, which video works, whether a recording gives you queue lengths and where footage is stored. Each answer is short and gives you the figure behind it. For live camera streams, see GoodVision Live Traffic instead.
How Accurate Is Video Insights?
95%+ on counts and classifications, validated against manual counts. Stable, well-framed footage is what keeps it there.
How Long Does Processing Take?
Within hours for traffic camera and low-drone video. High-drone video comes back the same day.
What Video Can I Upload?
Recordings from fixed cameras, drones or any other source. At least 95% of a video's frames must decode, and re-encoding usually fixes a damaged file.
Can I Get Queue Lengths From a Recording?
No. Recorded video gives you occupancy time, the delay and queue waiting time per road user. Queue monitoring is a Live Traffic scenario.
Do I Need to Reprocess to Add a Movement?
No. Outputs are built from the trajectories already extracted, so you can add movements and reports at any time.
Where Is My Footage Stored?
In GoodVision Vault, the secure cloud storage built into Video Insights. It stores and plays back your footage and can process video while it is still uploading.
Run Your Next Survey Through Video Insights
Send us a recording from a site you are studying and we will show you the counts, turning movements and origin-destination matrix it already contains.