
Traffic Data Analytics Built on Every Trajectory
Traffic data analytics in GoodVision Video Insights turns the trajectories extracted from your survey video into dashboard widgets, visual maps and Excel reports you can hand to a client. It is built for traffic consultancies, modelers and planners. You build each output from a metric narrowed by filters, and you can add new analyses to footage you processed months ago without processing it again.
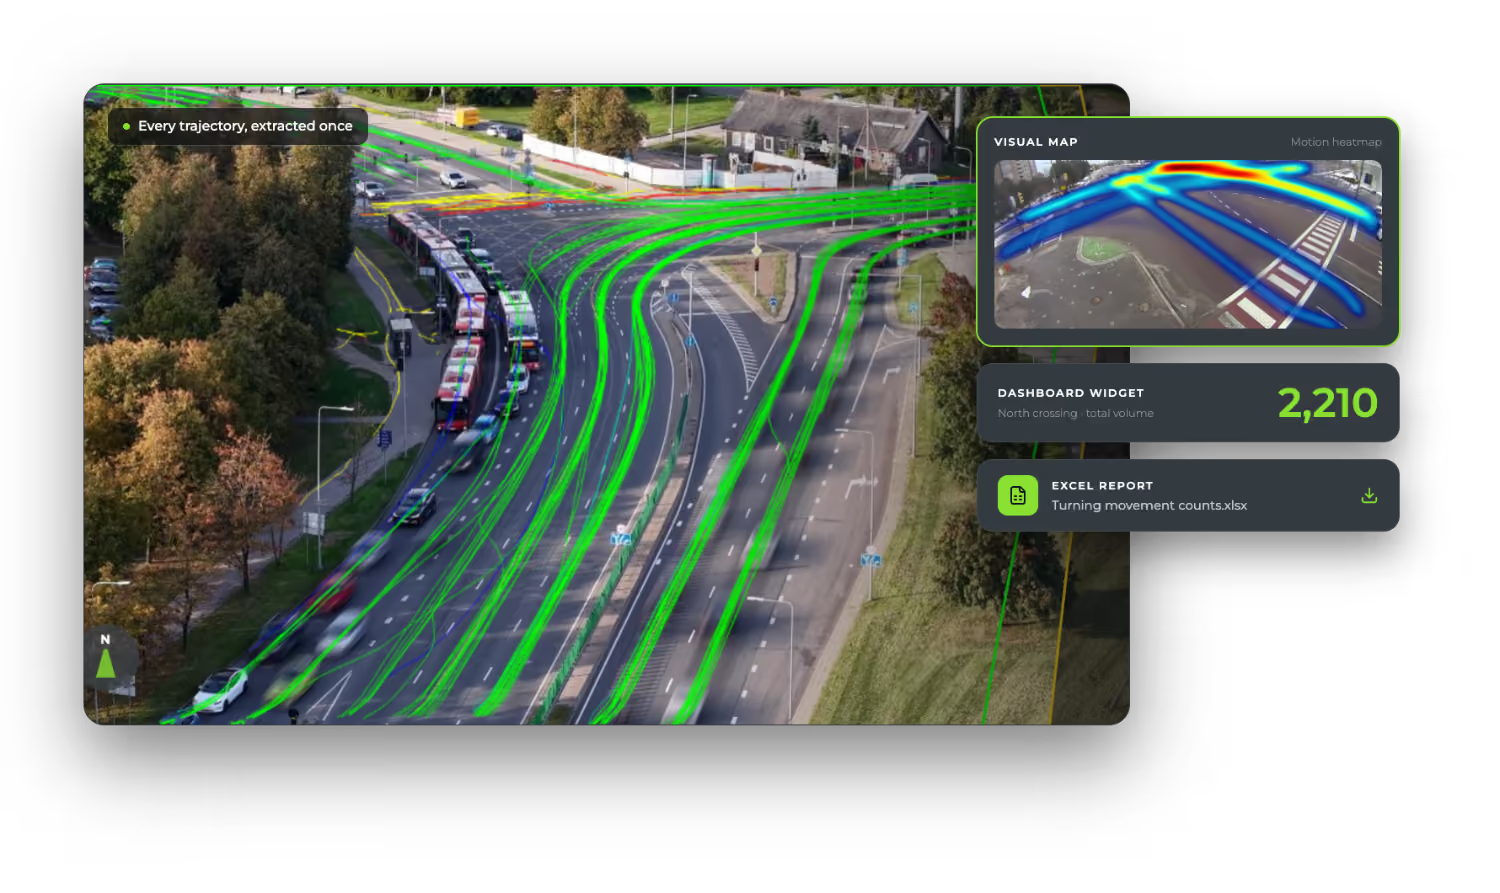
Traffic Analytics by the Numbers
How Is a GoodVision Analysis Built?
Every analysis in Video Insights follows one chain. You pick a metric, narrow it with filters, then output it as a dashboard widget or as an Excel report. Widget and report are two parallel outputs of the same metric, so you can use either one on its own. The chain is what makes a result repeatable and auditable.
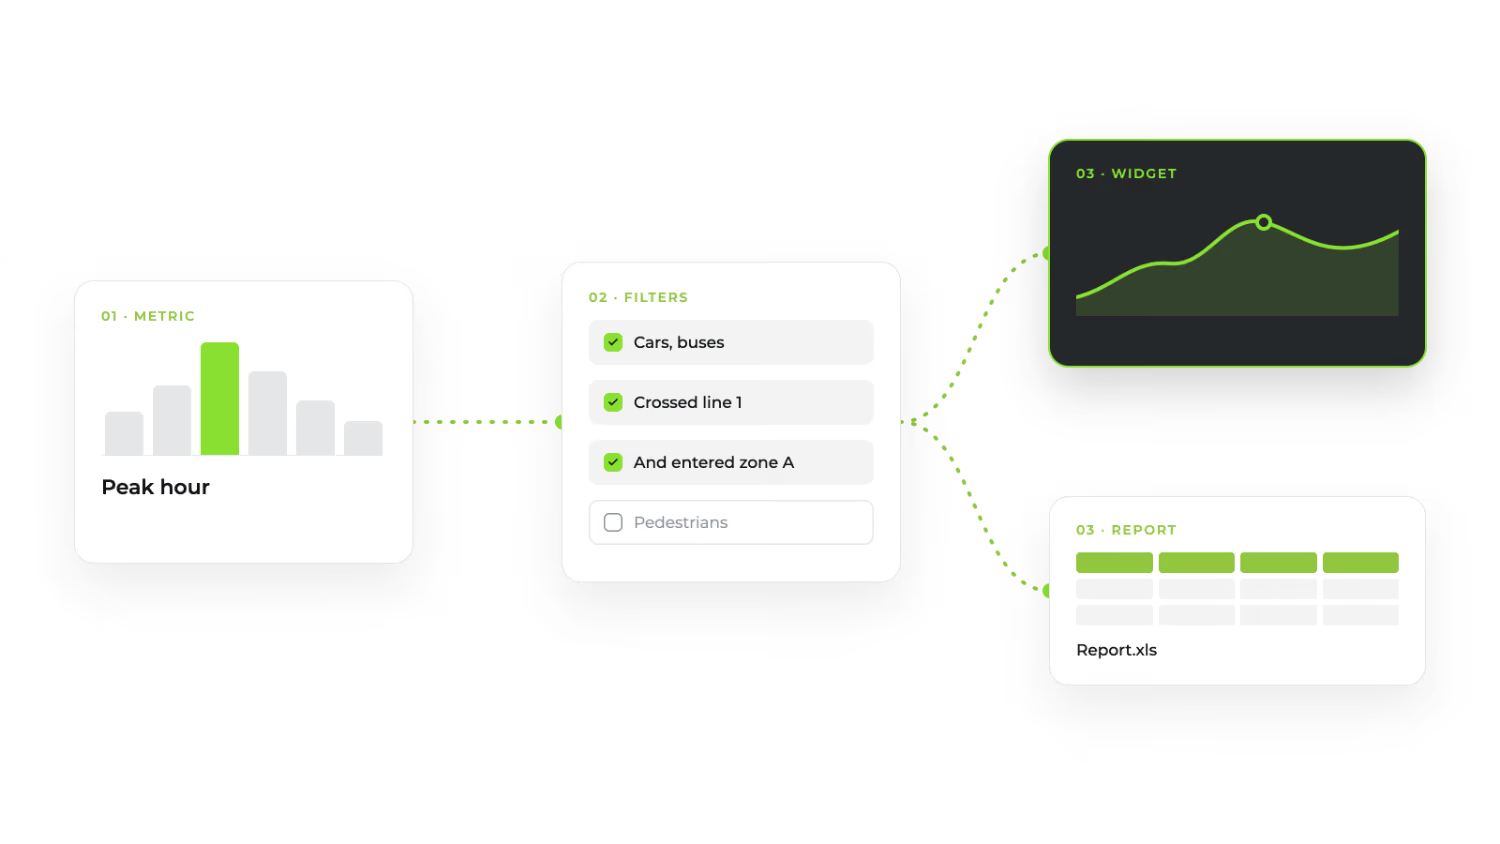
1. Metric
What you measure. Distribution across time periods, individual occurrences of movements and events, the peak hour, or post-encroachment time for safety work.
2. Filters
Which road users count. Line crossings, zone events and boolean combinations narrow the metric to the movements your study is about.
3. Widget or Report
How you present it. A widget for a live dashboard, an Excel report in .xls format for the deliverable, or both.
Which Filters Narrow a Metric?
Filters decide which road users and which movements a metric counts. You draw lines and zones on the scene, then combine them into the movements your client asked about. Eight filter types are in production, grouped into crossings, zone events and advanced filters that handle origin-destination work and boolean logic.
Directional and Bi-Directional Cross
Road users crossing a line in one direction, or crossing a line or zone in either direction.
Multi Cross
Movement across several lines or zones in sequence, for routes through a junction or corridor.
U-Turn
U-turn maneuvers across the lines you placed.
Stay and Stop Events
A vehicle dwelling in a zone for a set time, or stopping inside it. Available on the Modeller plan.
Generate OD Movements
Place lines at every entry and exit and GoodVision generates all the origin-destination movements for you.
Complex Filter
Combine several movements and events with boolean logic, for questions that span more than one line.
What Can You Put on a Traffic Dashboard?
A dashboard in Video Insights is a set of widgets, each one a metric you configured upstream. Sixteen widgets are in production, from volume and speed figures to heatmaps, trajectory diagrams and Sankey flow diagrams. They give your client a picture of the site beyond a table of counts.
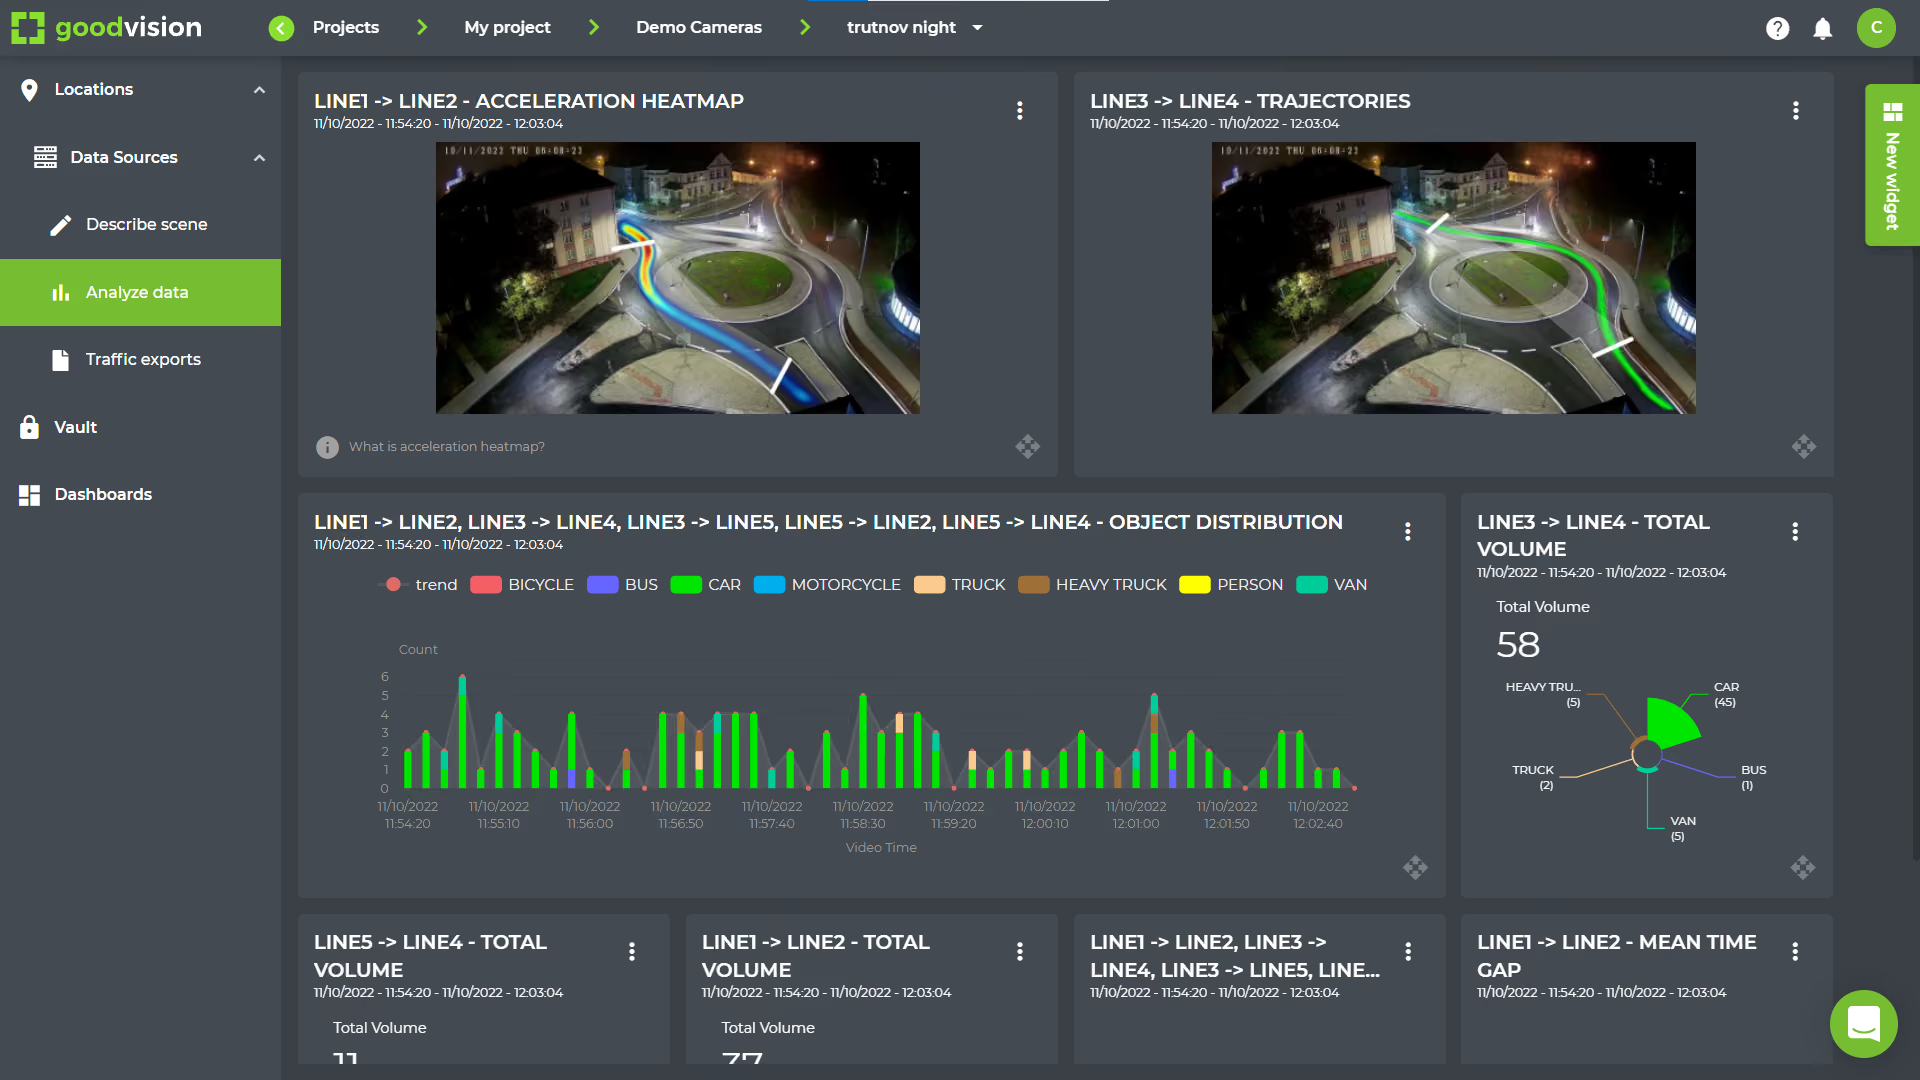
Volume and Composition
Total volume, average volume, object distribution by class, peak hour and the vehicle list behind them.
Movement Timing
Mean travel time between two points, mean time gap between vehicles, and occupancy time for delay.
Speed
Average speed and 85th-percentile speed for the movements and period you select.
Heatmaps
Motion, acceleration and hold-up heatmaps show where traffic concentrates, speeds up and waits.
Trajectories and Flows
Spaghetti diagrams of every path through the scene, and Sankey diagrams of how traffic splits between movements.
Collision Points
Where near-miss conflicts cluster on the scene, from the Traffic Safety Suite.
Safety Analysis Uses the Same Footage
Post-encroachment time is one of the four metrics, so near-miss widgets sit on the same dashboard as your counts. For conflict studies, PET and TTC reports and what the Safety Suite measures, see Road Safety Analysis.
How Do You Deliver Results to a Client?
You deliver results as Excel reports, as shared dashboards, or as a finished report GoodVision prepares for you. Reports come in three groups, and every one is built from data you already extracted. The list of report types and what each contains is on the Traffic Data Collection page.
Three Report Groups
Traffic statistics (counts, multi-source TMC, OD matrix, vehicle list), functional (peak hour, saturation flow, speed bins) and safety (PET and TTC). All in .xls format.
Shared Projects
Share projects, results and reports with colleagues and clients in one place, so everyone works from the same numbers.
Video Behind the Data
Footage stored in GoodVision Vault links to widget data points, so you can play back the event behind a figure.
Gap Acceptance
Available as an Excel report prepared by the GoodVision Customer Success team from your survey data.
Analysis Done for You
Choose a partially assisted service level and GoodVision support staff run the analytics and deliver the report.
Your Data Stays Yours
GoodVision never trades client data and protects it with premier security. Data is encrypted, and you sign in with Google, Microsoft or another identity provider.
Questions Analysts Ask About the Platform
These are the questions analysts and modelers ask before they commit a project to Video Insights: whether old footage can answer new questions, what each plan unlocks and where the limits are. For the product overview, see Video Insights, and for the consultancy view, Traffic Consultancies.
Can I Run New Analyses on Old Footage?
Yes. Every widget and report is built from the trajectories already extracted, so you add movements, filters and outputs at any time without processing the video again.
Is There a TTC Widget on Recorded Video?
On recorded video, time to collision comes as an Excel report. PET is a metric, so it drives both widgets and reports.
Which Plan Do I Need for Zone Events?
The Stay and Stop event filters are available on the Modeller plan. The Surveyor plan shows them disabled.
Can I Get an Origin-Destination Matrix?
Yes, self-serve. The Generate OD Movements filter creates the movements and the OD Matrix report exports them.
Can GoodVision Do the Analysis for Us?
Yes. With a partially assisted service level, GoodVision support staff run the analytics in the platform and deliver the report.
Build Your Next Client Dashboard on Video
Send us footage from a site you already surveyed and we will show you the counts, heatmaps and flow diagrams you can build from it.