
Survey Data, Model Inputs and Safety Studies From Your Own Video
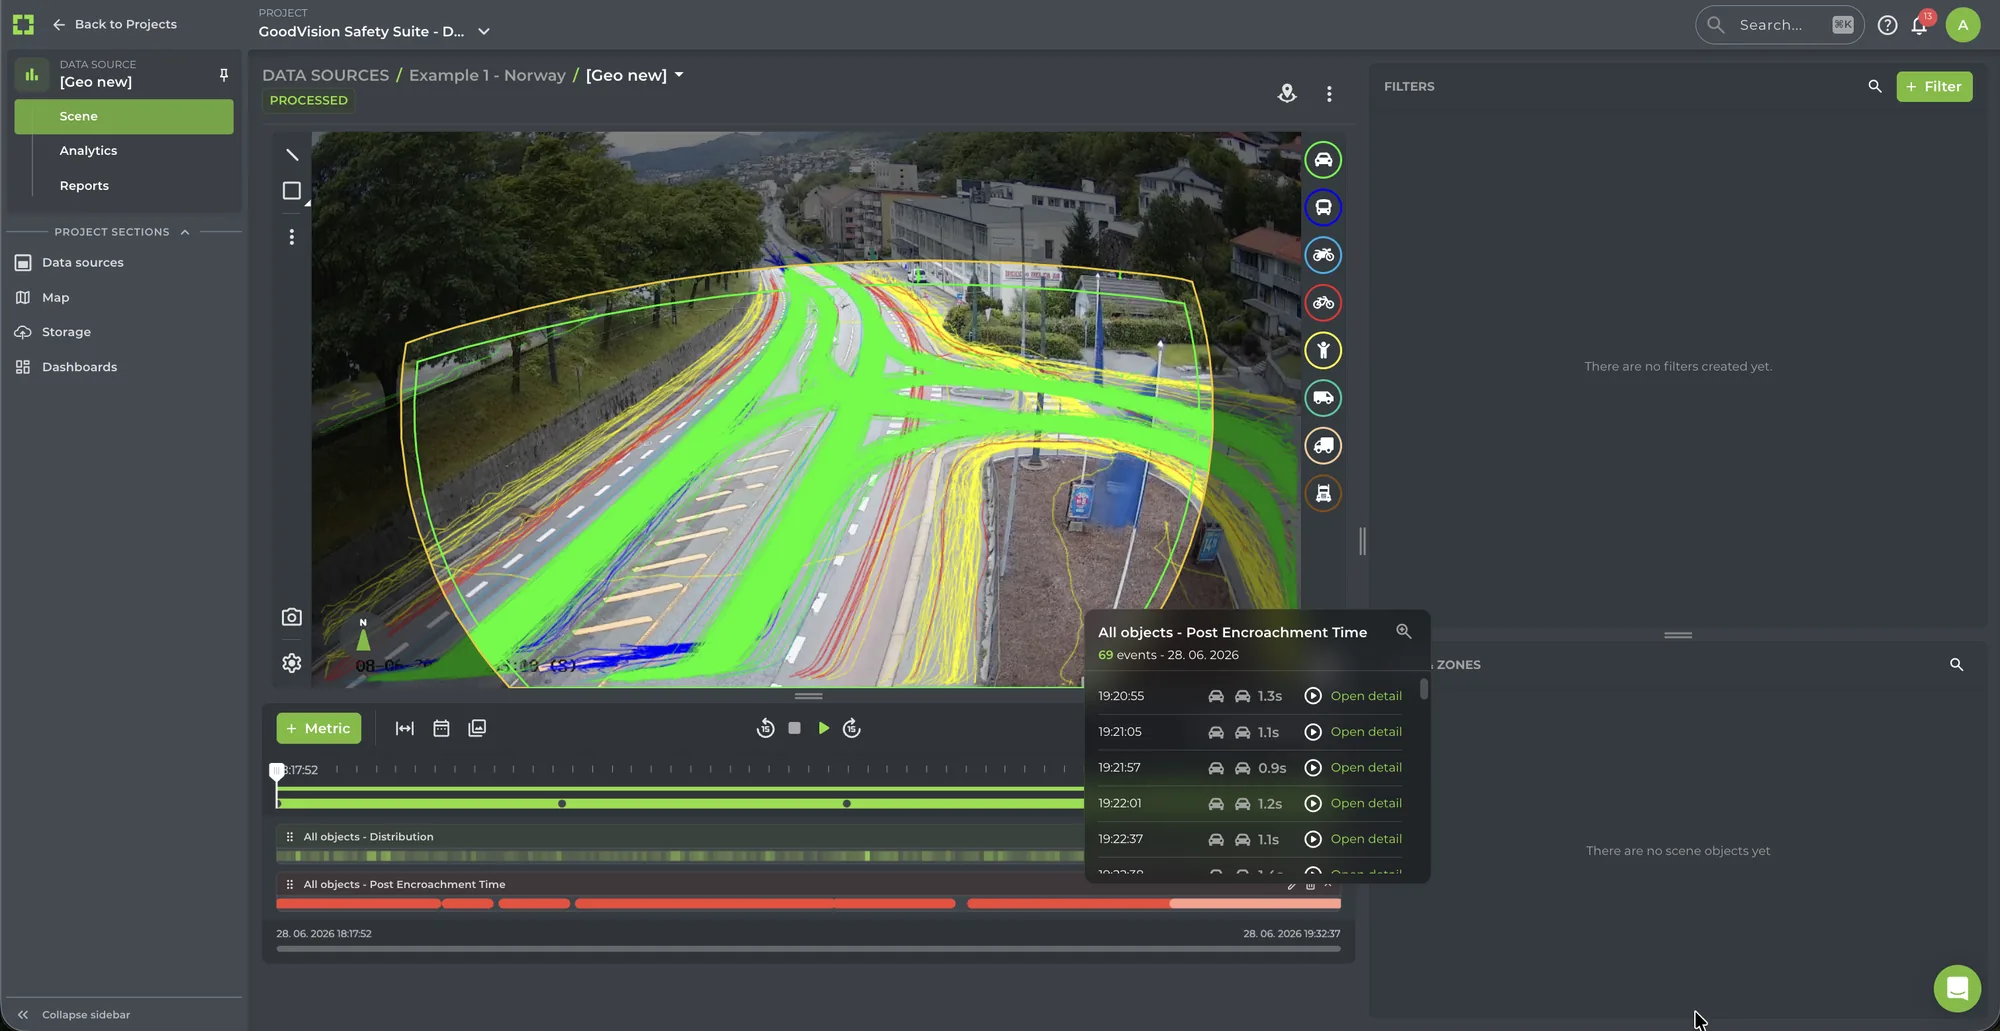
GoodVision gives traffic consultancies, survey firms and modelers three capabilities on one platform. Traffic Data Collection turns camera and drone video into classified counts and origin-destination matrices at 95%+ accuracy, validated against manual counts. Traffic Data Analytics builds model calibration inputs, dashboards and heatmaps from the same trajectories. Road Safety Analysis scores near-misses with PET and TTC. You process a video once and report from it as often as the project needs.
Survey Work by the Numbers
Counting Is the Slowest Part of the Study
Manual counting and validation eat the budget before the analysis starts. A four-hour junction video took one Greek consultancy at least 1.5 hours to analyze by hand, with results they did not fully trust. With GoodVision the same video took half an hour at most after upload. The time goes back into the work your client is paying for.
Results from fixed-camera and low-drone video come back within hours. High-altitude drone video comes back the same day.
Record the site with a camera or a drone, and GoodVision counts every road user in the footage.
Vehicles, pedestrians and cyclists come out of the same video, in the same study, with the same trajectories.
One Platform for Every Kind of Footage
Any recording works, from a permanent CCTV camera, a temporary tripod mast or a drone. You choose a processing mode that matches the footage, and the trajectories come out the same way for all three, so a survey can mix sources.
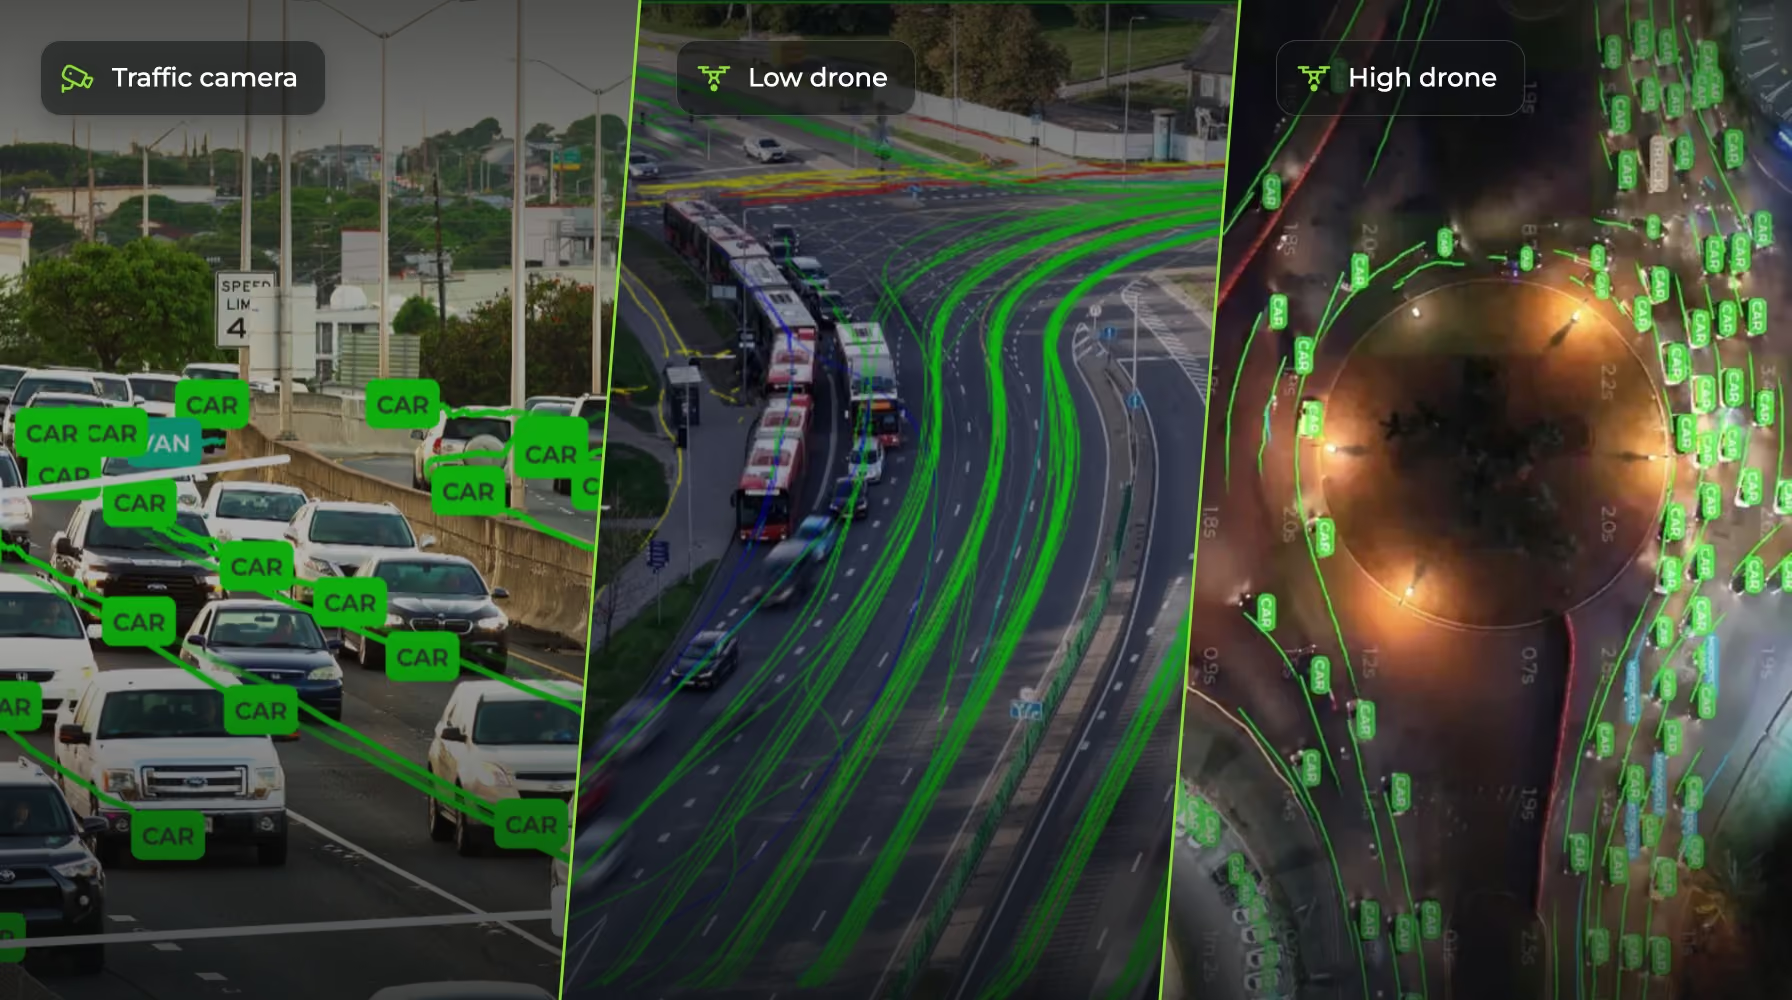
Traffic Camera
Fixed or temporary roadside cameras. Pedestrian class included. Results within hours.
Low Drone
Drone footage from low altitude. Pedestrian class included. Results within hours.
High Drone
High-altitude drone footage for the big picture over a whole junction. Pedestrians are counted in Low Drone mode. Results the same day.
Classification Schemes
GoodVision classifies road users with a global scheme you can use on any project. On request, you can add regional schemes, including Singapore and Latin American passenger-transport categories, and custom vehicle configurations such as trailer combinations. Drone surveys use the global scheme.
Traffic Data Collection
Traffic data collection replaces tube counters and manual tally sheets with a recording and an AI that tracks every road user in it. You upload video from a fixed camera, tripod mast or drone, and Video Insights returns classified turning movement counts, origin-destination matrices, travel times and speeds. Fixed-camera and low-drone video comes back within hours.
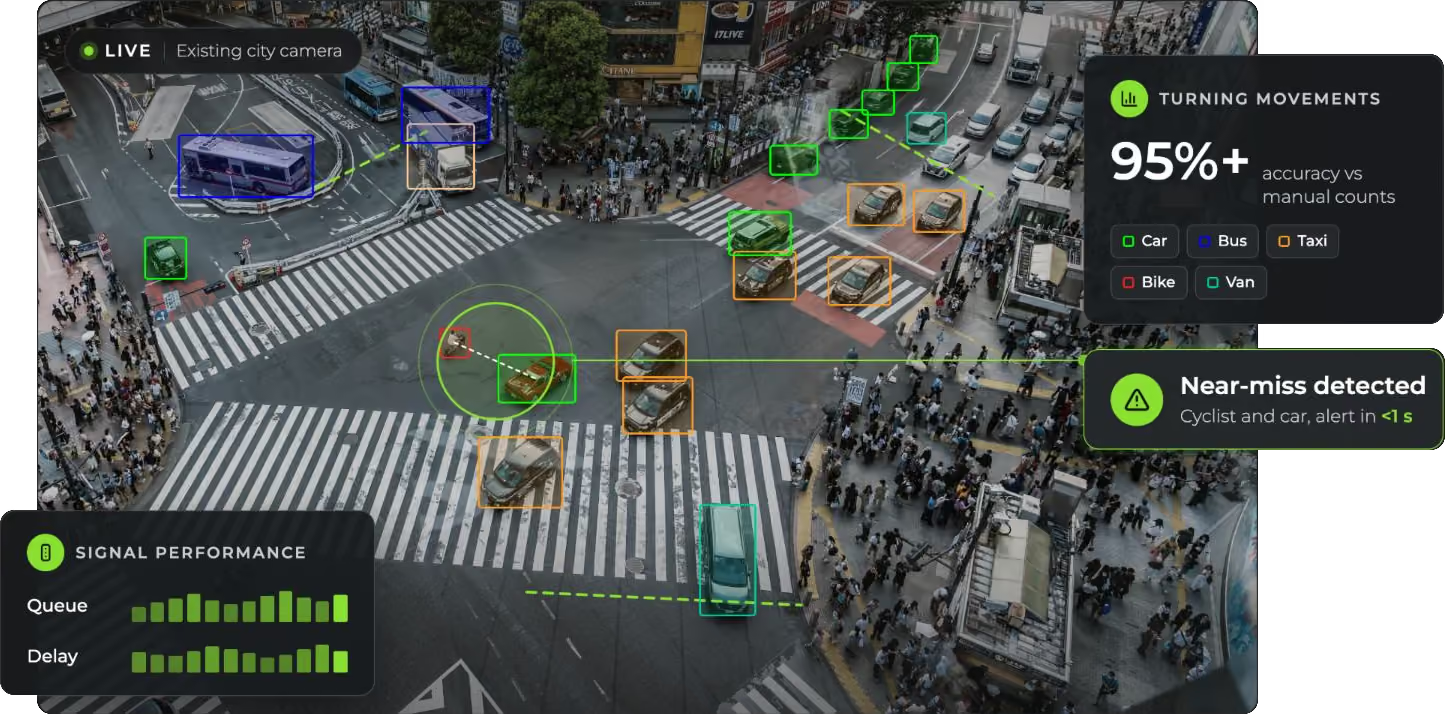
95%+ Accurate Counts
Counts and classifications at 95%+ accuracy, validated against manual counts, with vehicles, pedestrians and cyclists in the same study.
Turning Movements and O-D Matrices
Classified counts for every movement you draw at junctions, roundabouts and motorway sections, plus a matrix of where each road user entered and left.
Excel Reports From One Processing Run
Count, multi-source TMC, O-D matrix, peak hour, saturation flow and speed bin reports export in .xls. Add a movement later without processing the video again.
Traffic Data Analytics
Model calibration needs turning volumes, routes and travel times that match the street. Traffic Data Analytics builds them from the trajectories in your survey video. You pick a metric, narrow it with filters and output it as an Excel report or a dashboard widget, so the figures your modelers calibrate against are repeatable and auditable.
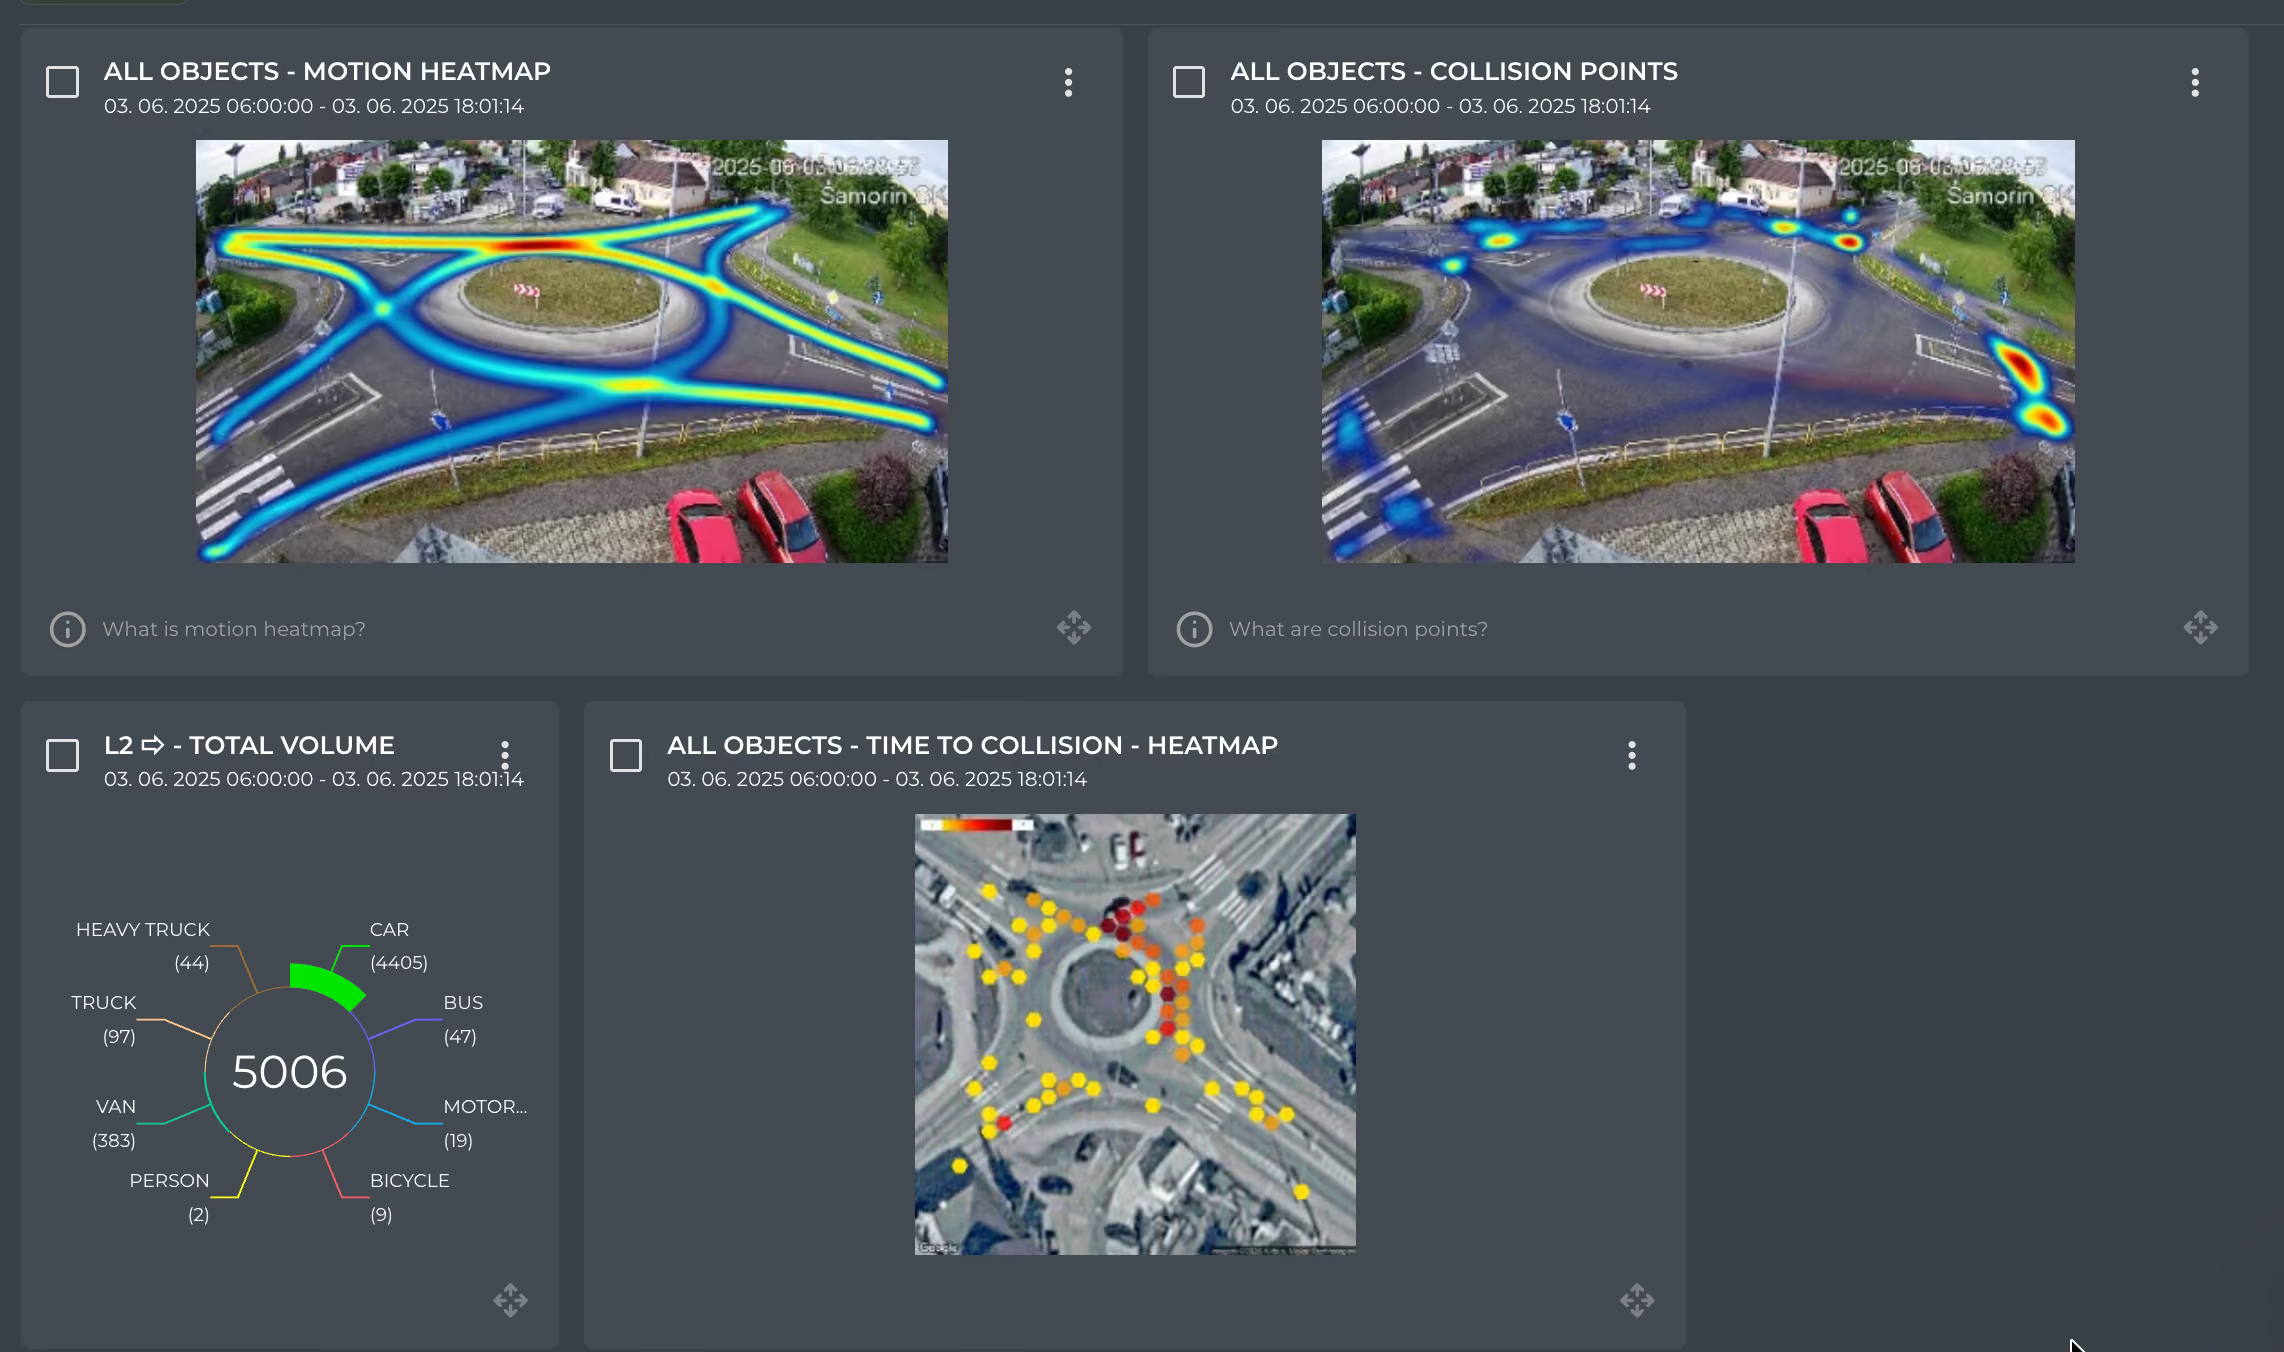
Inputs for Model Calibration
Origin-destination movements from the Generate OD Movements filter, mean travel times, occupancy time for delay and saturation flow reports, all from one survey video.
One Chain Behind Every Figure
Every output follows the same chain of metric, filters and widget or report, so a modeler can see exactly which road users each figure counts.
16 Widgets for Client Reports
Motion, acceleration and hold-up heatmaps, trajectory spaghetti diagrams and Sankey flow diagrams sit beside your counts. Add new analyses to old footage without processing it again.
Road Safety Analysis
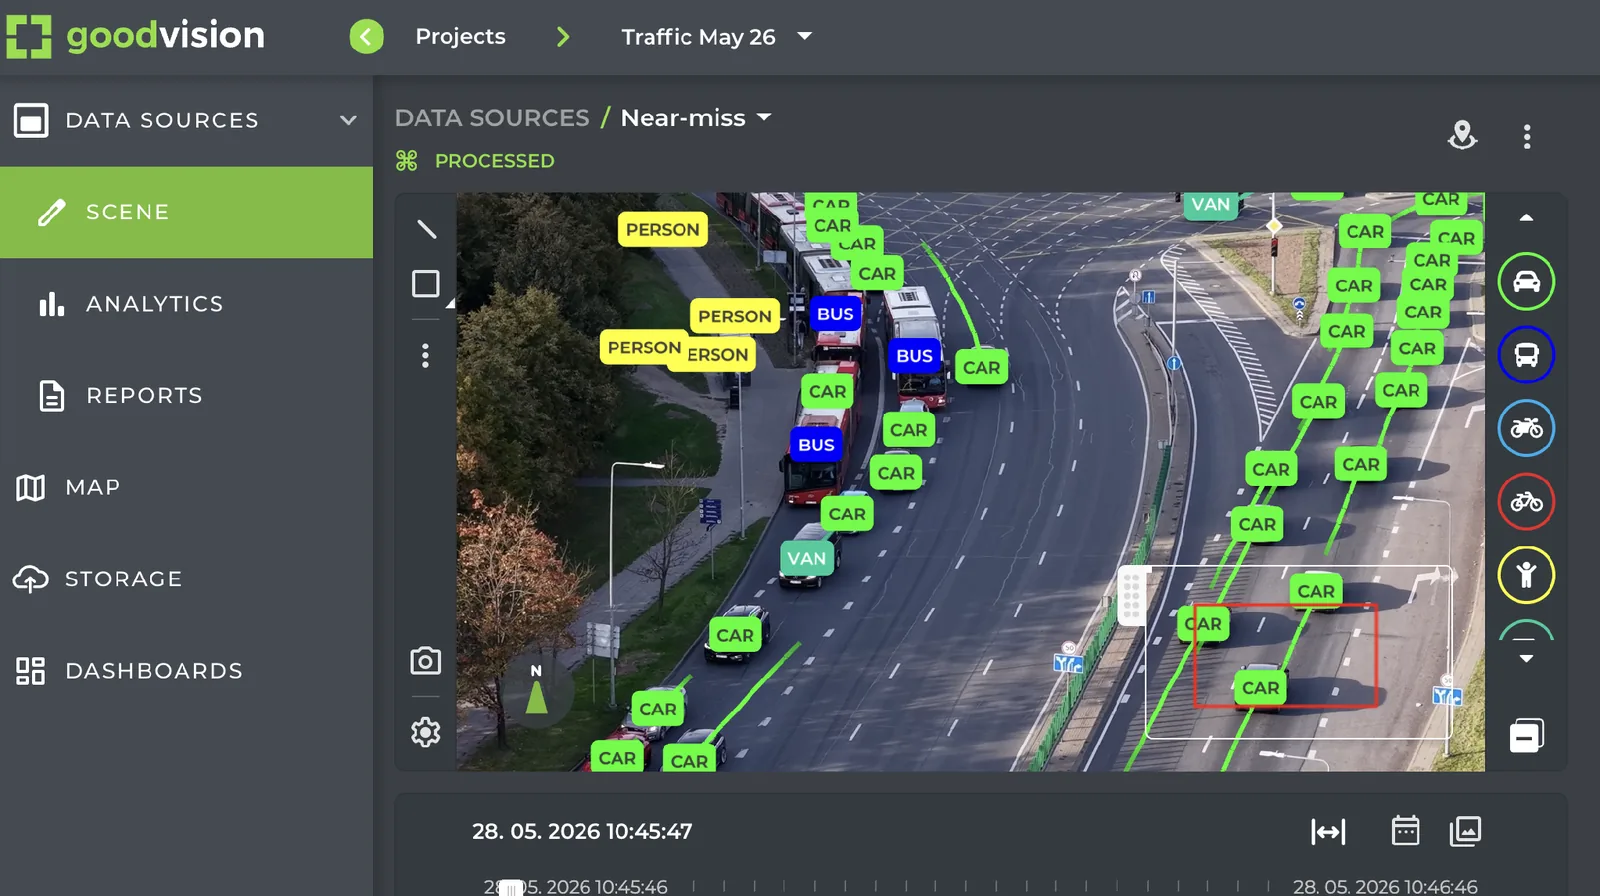
Crash records take years to build a sample at one site. Road Safety Analysis scores near-misses in the footage you already recorded, using post-encroachment time (PET) and time to collision (TTC). You judge the risk at a junction this month and act before the crash record shows it.
PET and TTC Scoring
Every conflict scored by post-encroachment time and time to collision, with a TTC window you set from 0.1 to 1.5 seconds and angle filtering.
90% Faster Than Manual Review
A study runs 90% faster than reviewing the video by hand and costs 80% less than traditional forensic road safety analysis.
Video Evidence for Every Event
Vehicles, pedestrians and cyclists in one study. Each conflict keeps its clip, and you can share the event page with your client by link.
Consultancies Already Delivering With It
Engineering firms and survey specialists in Europe, Asia and North America run their counts through GoodVision. Each row shows the type of firm, the number that made the project work and what they delivered with it. Every one of these is a real customer project.
Turning movements by vehicle type on 16 junctions. A four-hour video took half an hour to analyze instead of at least an hour and a half.
Counted in 14 days, plus more than 113,000 cyclists across four locations around a city park.
Video review for a 12-hectare transit development took about two weeks instead of about a month of manual counting.
Traffic, parking and person survey at a biomedical campus over one 18-hour period.
Drone surveys of up to four hours of video a day, analyzed on the day they were flown.
Model calibration parameters into PTV Vissim and a design solution, inside a 14-day sub-project deadline.
Questions Consultants Ask
These are the questions that decide whether GoodVision fits your next survey: how accurate it is, how fast the results come back, what footage works and how you keep control of the data. Each answer gives you the numbers behind it.
How Accurate Are the Counts?
95%+ on counts and classifications, validated against manual counts. Stable, well-framed footage is what keeps it there.
How Fast Do Results Come Back?
Within hours for fixed-camera and low-drone video, and the same day for high-altitude drone video.
What Video Can I Upload?
Recordings from fixed cameras, temporary tripod cameras and drones. A video needs to decode cleanly, and re-encoding usually fixes one that does not.
Do I Need to Buy Hardware?
No. GoodVision is software. You record with the cameras or drones you already use.
Can I Add a Vehicle Class My Client Needs?
Regional schemes and custom vehicle configurations are available on request. Drone surveys use the global scheme.
How Is Our Data Protected?
GoodVision runs on premier security. Data is encrypted and securely stored, and you can sign in with Google, Microsoft and other identity providers.
Send Us Video From Your Next Survey
Upload a recording from a junction you are studying and we will show you the counts, the O-D matrix and the conflicts it already contains.