
Traffic Data Your System Can Read Directly
GoodVision turns camera video into structured traffic data and events that flow into the platform you already sell. Live events reach your system over HTTPS in under a second, and a public REST API returns counts, speeds and occupancy aggregated from one second to 24 hours. It is built for system integrators and technology partners who need a detection layer to feed their own product.
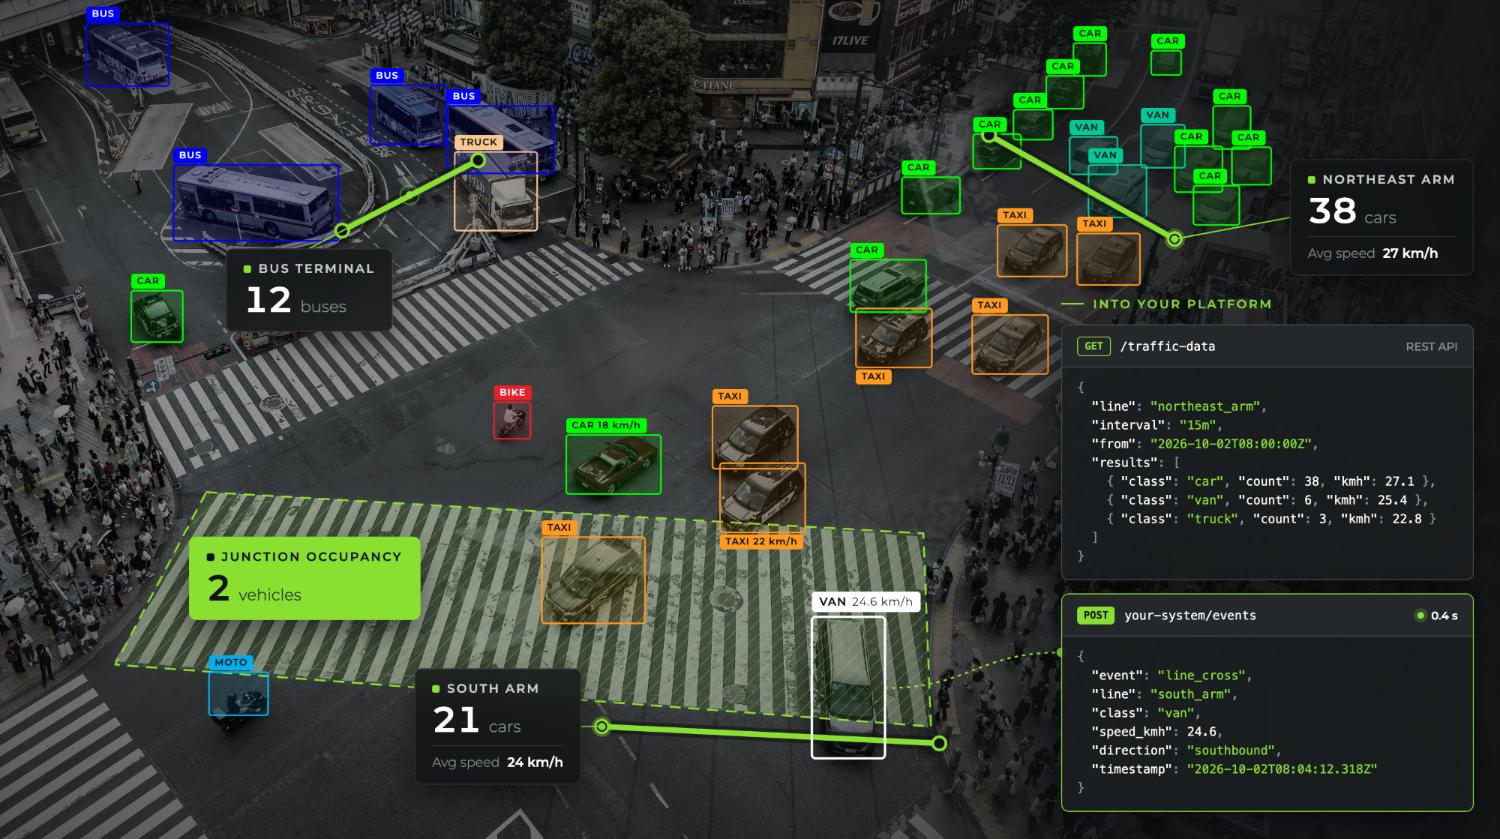
The Data Layer in Four Figures
What Data Can You Pull From GoodVision?
You get two kinds of data: events and aggregated traffic parameters. Events are individual detections with a timestamp, their parameters and an image snapshot. Parameters are counts, speeds, occupancy, time gaps, flow and density, grouped over the interval you choose. Every figure comes from road users detected and tracked in the camera view.
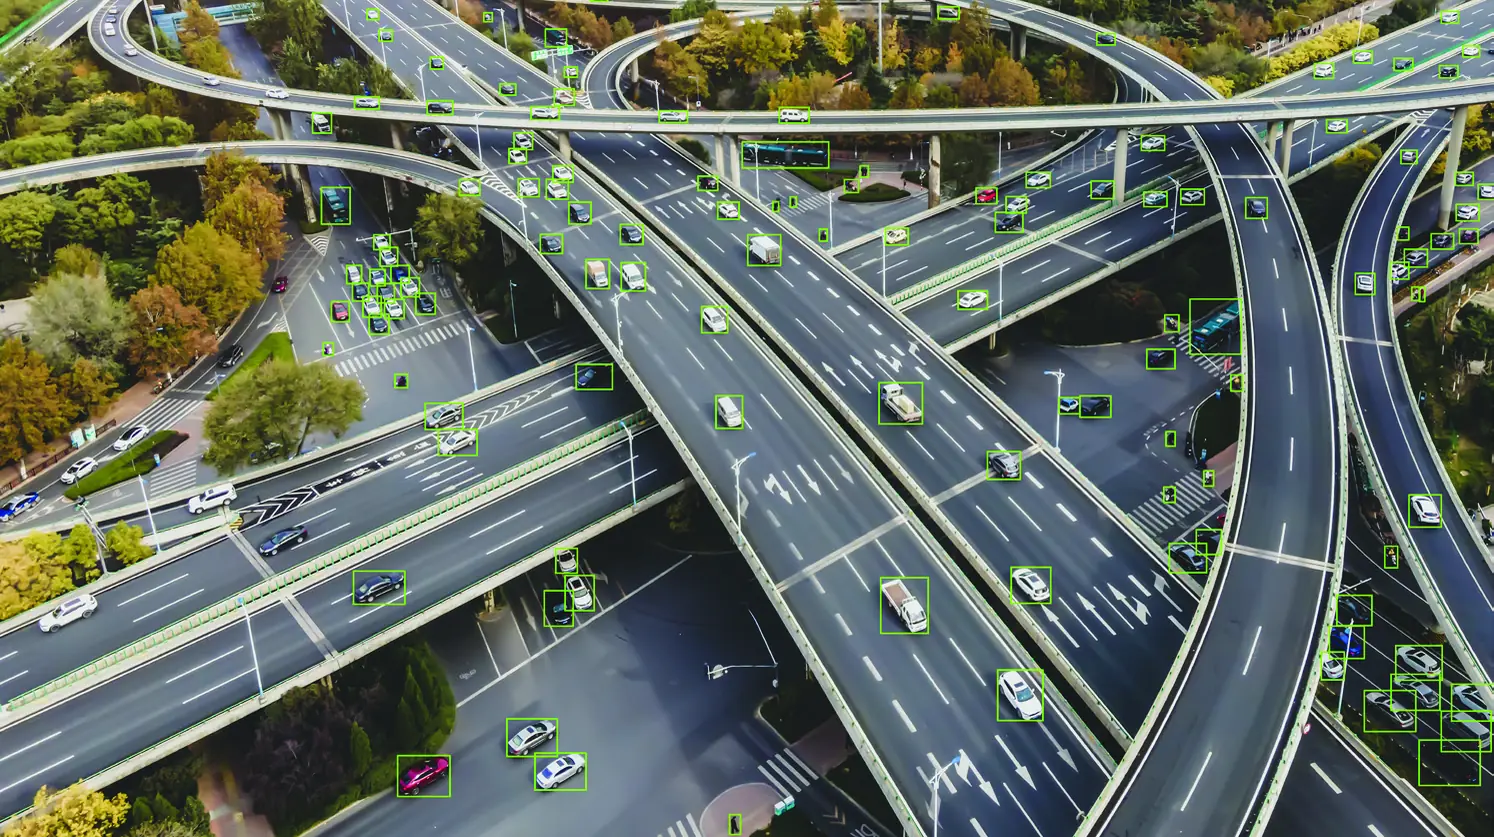
Traffic Events
Wrong-way driving, stopped vehicles, congestion and speed limit violations, each delivered as its own event with a precise timestamp and its parameters.
Counts and Classification
Vehicle counts by scenario, direction or vehicle type, filtered by object class and by the specific movement lane you monitor.
Speed and Headway
Average speed, 85th percentile speed and the average time gap between consecutive vehicles, reported per lane.
Occupancy, Flow and Density
Lane occupancy, vehicle throughput over time and vehicle concentration per distance unit, which is how you find a bottleneck before it becomes a queue.
Image Evidence
An image snapshot for each detected event, retrievable through the API, so an operator can check what the camera saw.
Near-Miss Safety Events
Conflict events scored by post-encroachment time (PET) and time to collision (TTC), with full event details on shared public dashboards available through the API without authentication.
Trajectories Behind Every Figure
Video Insights extracts full vehicle trajectories for every detected road user in a recording. Every count, speed and safety report is built from those trajectories, so you process a video once and generate as many reports as the project needs. See Video Insights for recorded video.
How Does the Data Reach Your System?
GoodVision pushes events and serves data on request. Events go out over HTTPS in under a second from detection. The REST API answers queries for aggregated data. Parking scenarios also push webhooks, and every scenario can produce reports in .xls format. Most integrations combine a push channel for alerts with the API for history.
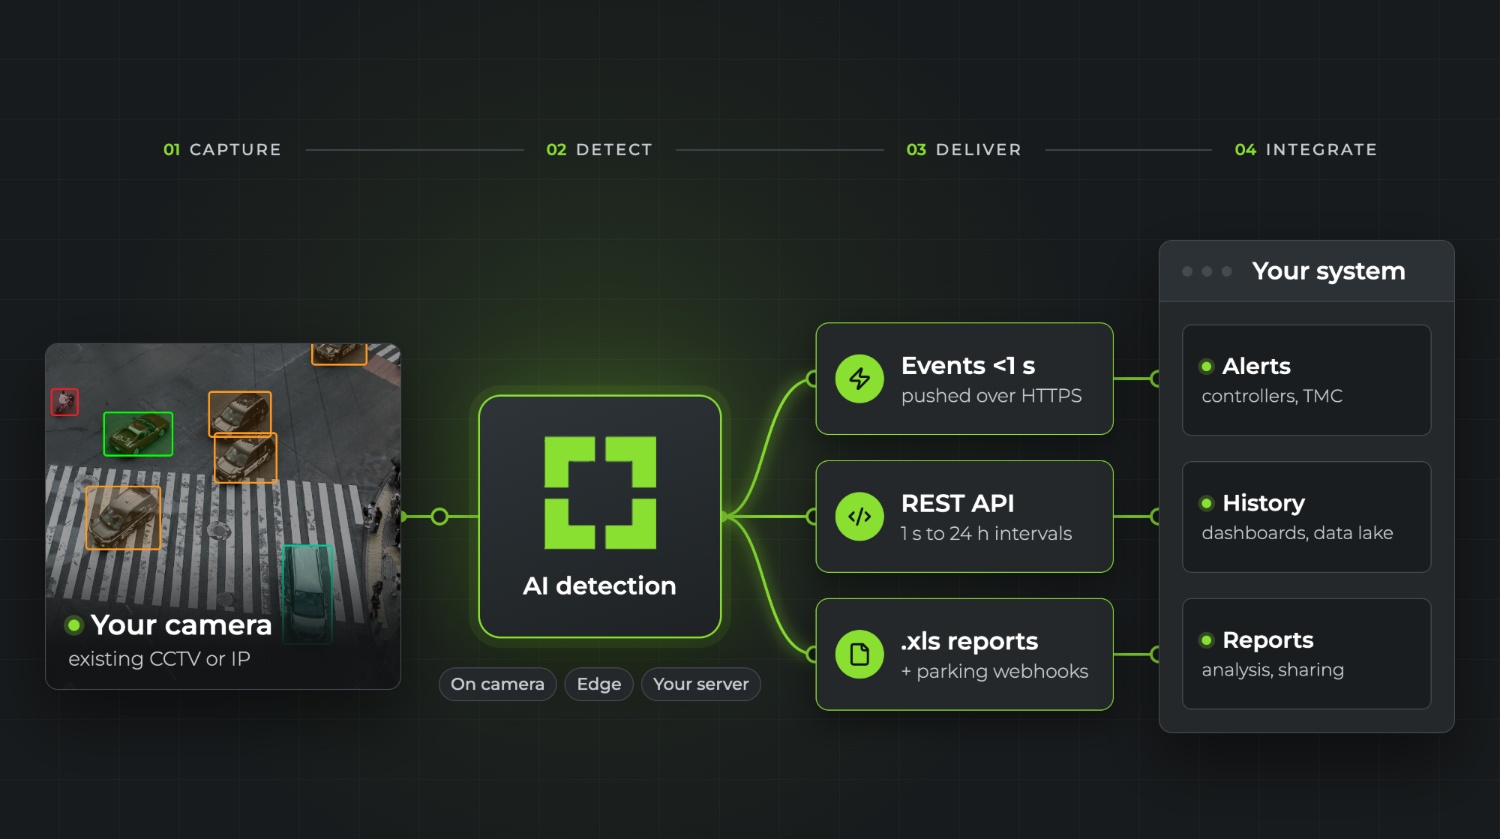
Events Over HTTPS
Alarms, notifications and structured event data sent to traffic controllers, dashboards and third-party platforms in under a second from detection.
REST API
Pull counts, average speeds, occupancy and every extracted parameter on demand, aggregated from one second to 24 hours.
Webhooks for Parking
Parking scenarios send a webhook on each session start and end, on each violation type and, if you choose, a periodic occupancy snapshot for every monitored space. See Parking Monitoring.
Reports in .xls
Live Traffic produces seven reports, from counts and events to speed, time gap, flow and density. Video Insights produces nine, including turning movement counts and an origin-destination matrix.
A Data Layer or an All-in-One Platform
Use GoodVision as a modular data layer, where events and traffic data flow into your own data lake and interface. Or store, analyze and present everything inside the GoodVision platform. Where the processing runs is a separate choice, covered on Deployment Topologies.
What Can the Live Traffic REST API Do?
The Live Traffic REST API gives your software the same data the GoodVision interface shows. You navigate the project structure, read the metadata for any monitoring point and query traffic parameters by time interval, object class and lane. The documentation is public, so your engineers can scope an integration before anyone signs anything.
Project Structure
Navigate projects and retrieve the metadata for any monitoring point, so your system maps each camera and scenario to its own asset register.
Time Aggregation
Group data into intervals from one second for live control up to 24 hours for daily reporting, in the same call pattern.
Class and Lane Filters
Filter by object class and by specific movement lanes. GoodVision classifies road users with global, regional and custom classification schemes.
Push for Alerts, Pull for Analysis
Use the HTTPS event push for anything that needs to reach an operator in under a second, and pull aggregates from the REST API on your own schedule. The product behind the API is Live Traffic.
Questions Integrators Ask About the Data
These are the questions that decide how GoodVision data fits your architecture: what comes out, how fast, in what form and at what rate, and who owns what comes out. Each answer gives you the specification behind it. For the commercial side, see White-Label Deployment.
How Fast Do Events Arrive?
In under one second from detection, over HTTPS. That is the path for wrong-way drivers, stopped vehicles and other events an operator has to see now.
How Much Historical Data Can We Query?
The API aggregates any stored period into intervals from one second to 24 hours. Standard data storage comes with each license, and you can extend capacity and retention.
Can We Match Our National Classification Scheme?
GoodVision classifies road users with global, regional and custom classification schemes, including Singapore and Latin American passenger-transport categories. Custom vehicle configurations are agreed per project.
Does GoodVision Detect Crashes?
No. It detects the conditions around an incident, such as a stopped vehicle or a wrong-way driver, and it scores near-misses with PET and TTC.
Who Owns the Data?
GoodVision gives you full transparency of data ownership. It never trades client data and protects all of it with encryption and premier security.
Map Your Integration With Our Engineers
Tell us which system the data has to reach and what it needs to do there. Our engineers will come back with the data model, the delivery channel and the integration path. Start from the System Integrators overview if you are new to GoodVision.