
Signal Performance Data From the Junction Itself
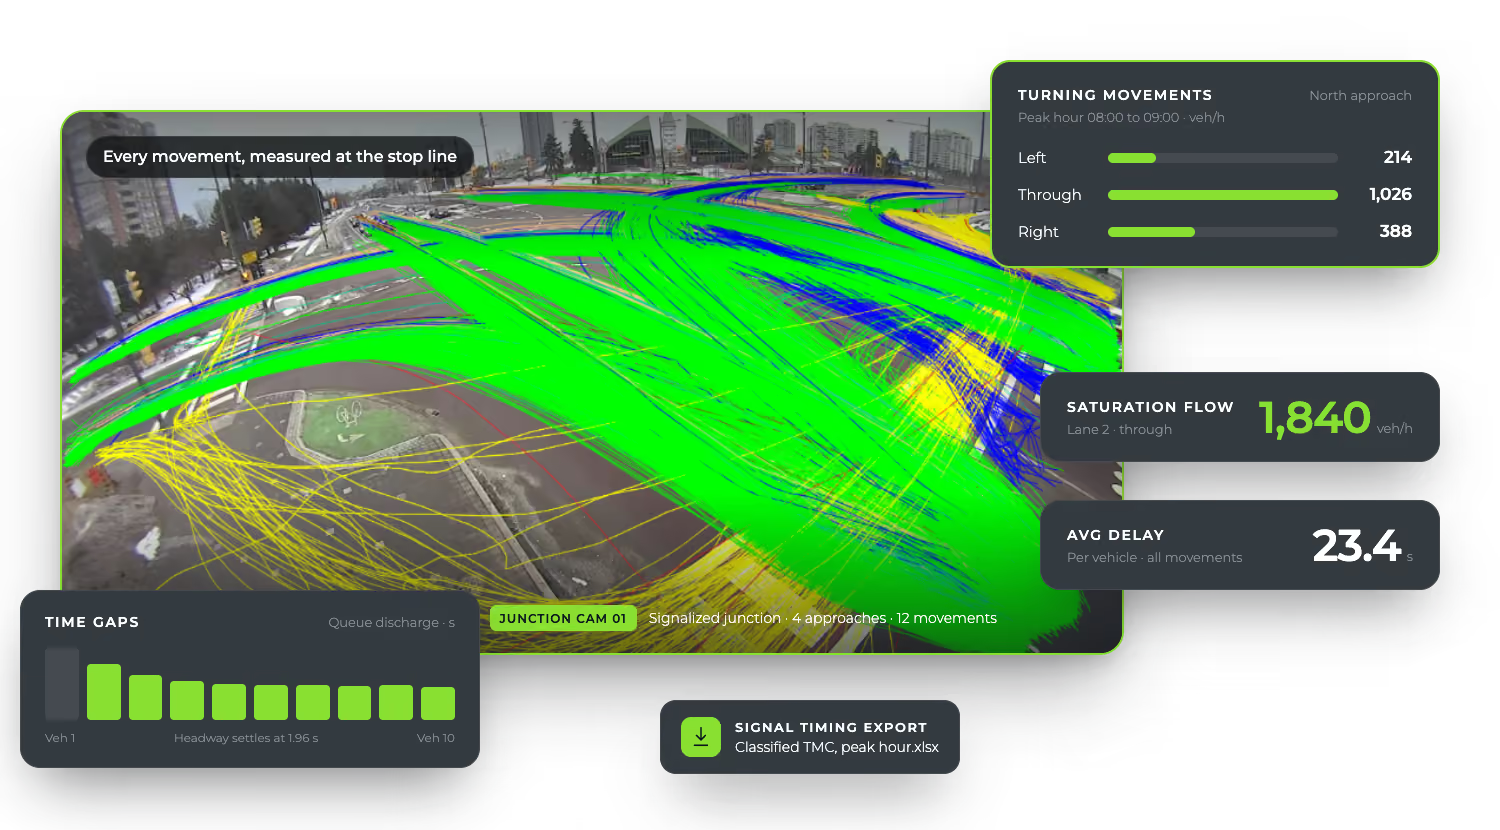
GoodVision gives city signal engineers the measured data a timing decision rests on: classified turning movement counts, peak hour, saturation flow, delay and time gaps for every movement at a signalized junction. It comes from your junction cameras, recorded through GoodVision Video Insights or live through GoodVision Live Traffic, which connects to signal controllers through its APIs.
What a Retiming Study Needs From the Street
A signal retiming study needs to know how much traffic wants each movement, how fast a queue discharges and how long road users wait. GoodVision measures all three from one camera view. Counts reach 95%+ accuracy, validated against manual counts, and every report exports to Excel in .xls format for your timing tools.
Classified Turning Movement Counts
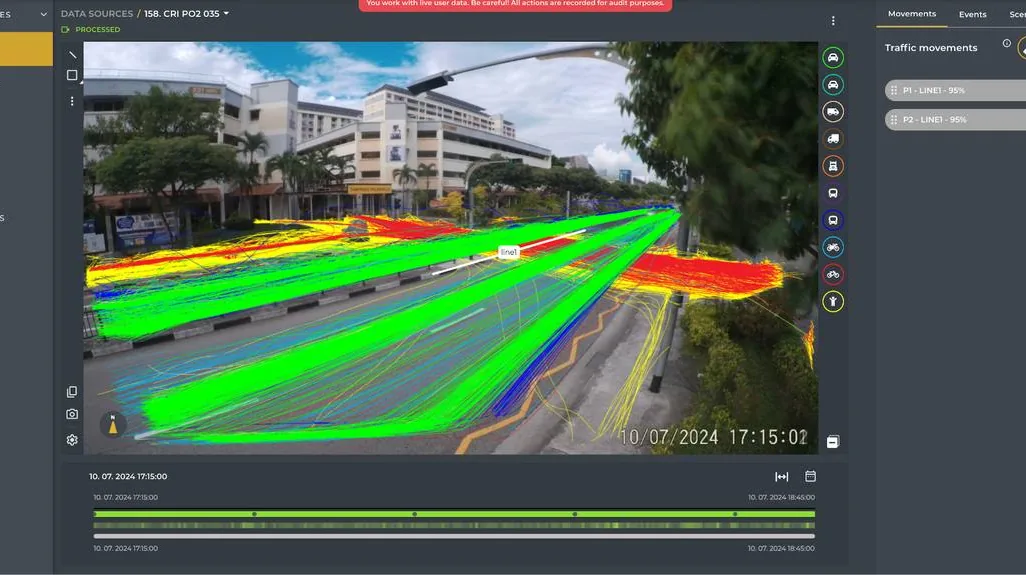
Demand per movement and per road user class, in the Count Report. Multi-source TMC combines counts from several cameras into one flow overview.
Peak Hour
The peak traffic hour for the movements you select, as a report and a dashboard widget.
Saturation Flow
The Saturation Flow report measures how fast traffic discharges from a stop line once it gets green.
Delay and Queue Waiting Time
Occupancy time measures how long road users are held at the junction, per movement.
Hold-Up Heatmap
A map of where vehicles are held up in the scene, so you can see which approach carries the delay.
Gap Acceptance
Gap acceptance analysis for turning and merging movements, produced as an Excel report by our Customer Success team.
How Do You Prove a Timing Change Worked?
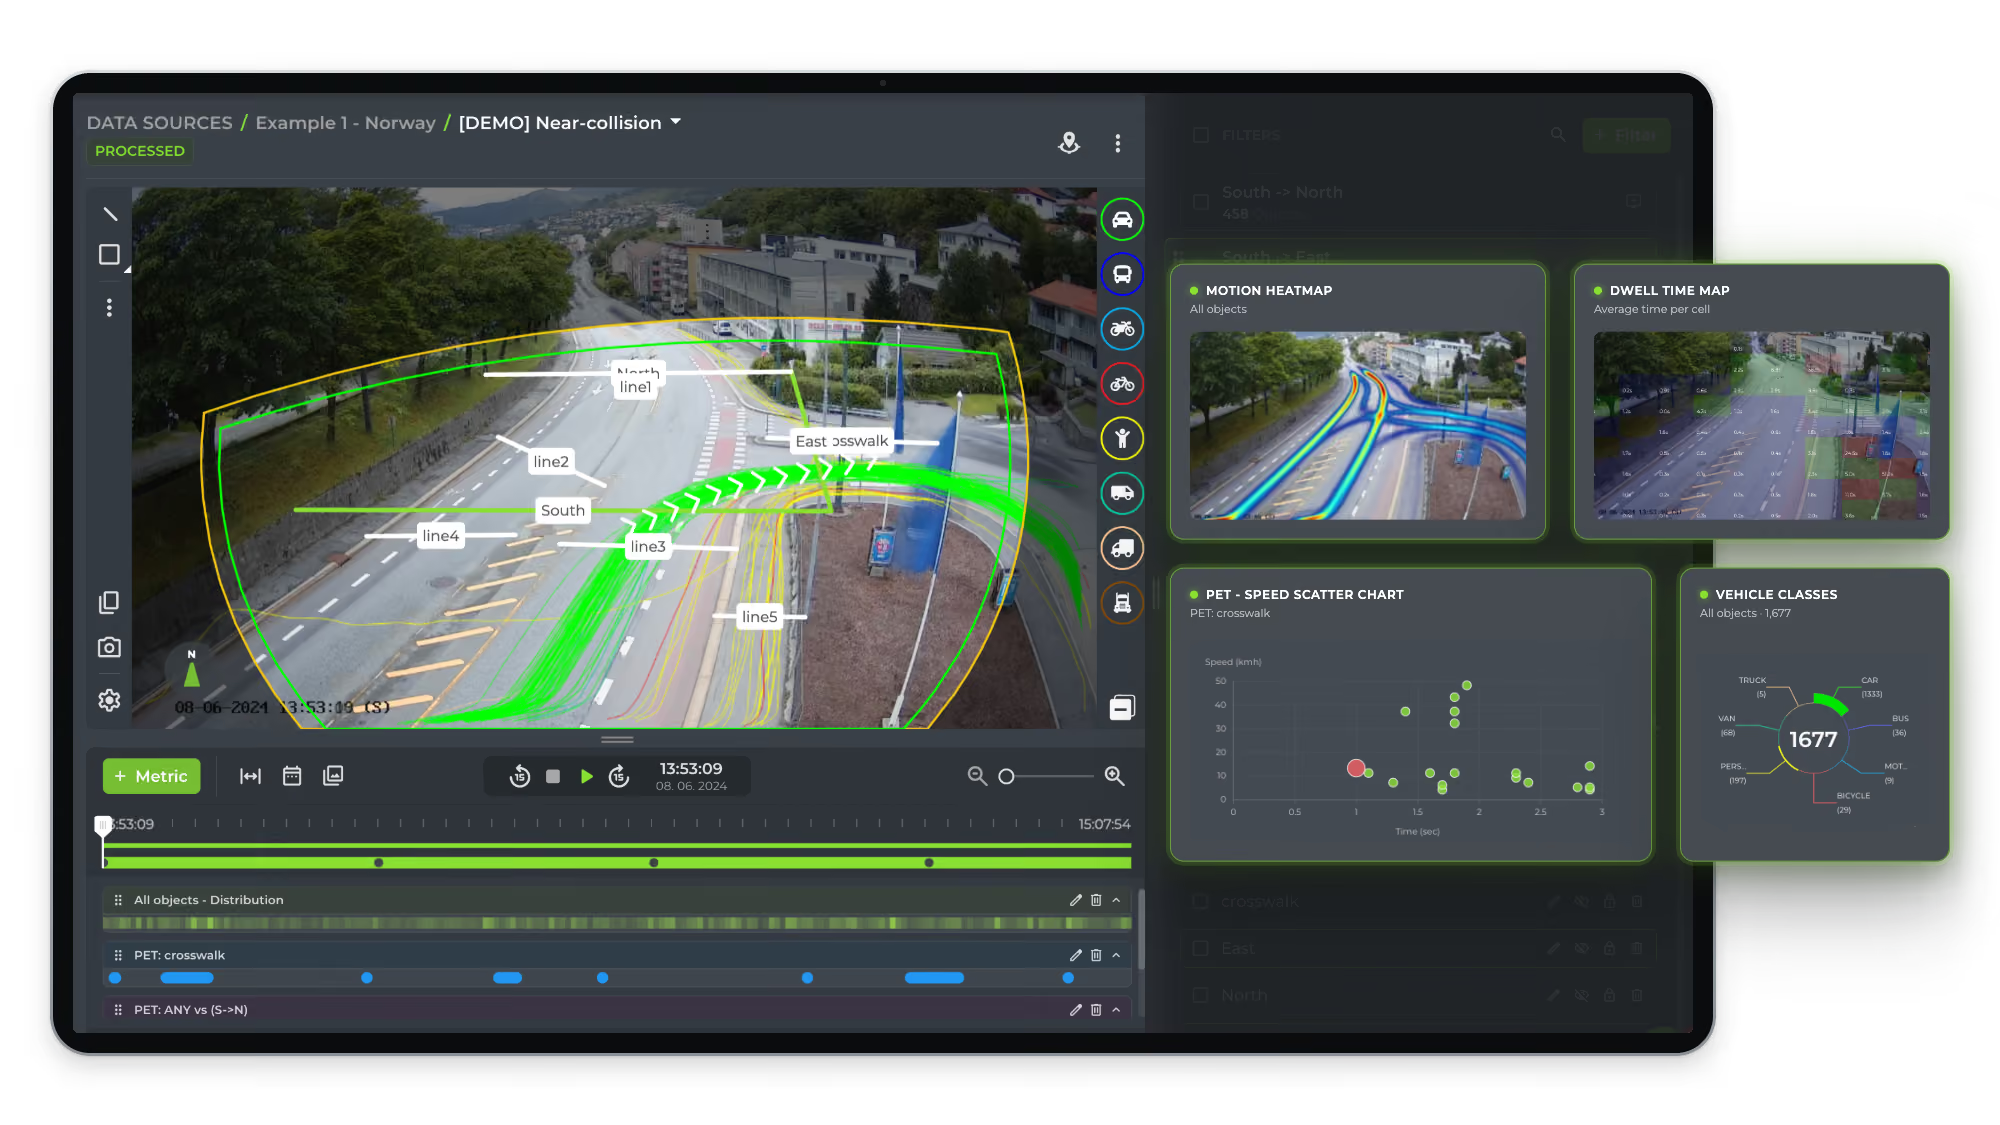
Record the junction before the change and again after it, then draw the same movements on both recordings. If the new timing works, the after study shows shorter waits and faster trips on the movements you retimed. GoodVision Video Insights processes each recording within hours and reports delay, travel time and counts for every movement. See GoodVision Video Insights.
Delay on Every Movement
Occupancy time shows how long road users were held on each movement. Compare it across the two studies to see which waits the new timing cut.
Travel Time Through the Junction
Mean travel time on each movement, to show whether the change cut the time it takes to get through.
A Fair Comparison
The Count Report for each recording shows whether both carried similar traffic, so you can credit a shorter wait to the new timing.
Continuous Signal Performance Data for Your Traffic Center
GoodVision Live Traffic measures the junction around the clock and integrates through its APIs with signal controllers and ITS systems. Its REST API serves counts, speeds and occupancy aggregated from 1 second to 24 hours, filtered by road user class and by movement lane, and live events reach you over HTTPS in under a second. See GoodVision Live Traffic.
Congestion per Lane
Congestion level on each lane, banded Light, Moderate or Heavy, raised as a live scenario.
Time Gaps and Flow
Average time gap, traffic flow and traffic density reports for each monitored approach.
Counts on Any Line
Directional and multiline crossings count every movement you draw on the scene, continuously.
One Junction, Three Views
The same cameras that measure signal performance also count every movement and score near-misses. See Intersection Monitoring for counts and live violation events, and Cities and Municipalities for the full intersection program.
Questions About Signal Performance Data
These are the questions signal engineers ask before they use GoodVision data in a timing study: which reports they get, how delay is measured, how accurate the counts are and how the data reaches their own systems. Each answer is short, and each one names the report or interface that delivers it.
Which Reports Does a Recorded Study Produce?
Count Report, Multi-source TMC, OD Matrix, Peak Hour, Saturation Flow and Speed Bins, among others, all exported in .xls format.
How Is Delay Measured?
As occupancy time, the time road users spend held at the junction, including queue waiting time. The Hold-up heatmap shows where it builds.
How Accurate Are the Counts?
Counts and classifications reach 95%+ accuracy, validated against manual counts.
Is Gap Acceptance Self-Serve?
No. It is available today, produced by our Customer Success team from an Excel template. Ask for it when you set up the study.
Can the Data Reach Our Signal Systems?
Yes. Live Traffic integrates through APIs with signal controllers, traffic management systems and dashboards, and its REST API aggregates data from 1 second to 24 hours.
Does It Work With Our Cameras?
In most cases, yes. GoodVision reads RTSP streams in H.264 or H.265 from cameras of any brand, at 640x480 to 1920x1080 and 10 to 50 frames per second.
Measure the Junction Before You Retime It
Send us a recording from one signalized junction and we will show you the counts, saturation flow and delay it already contains.